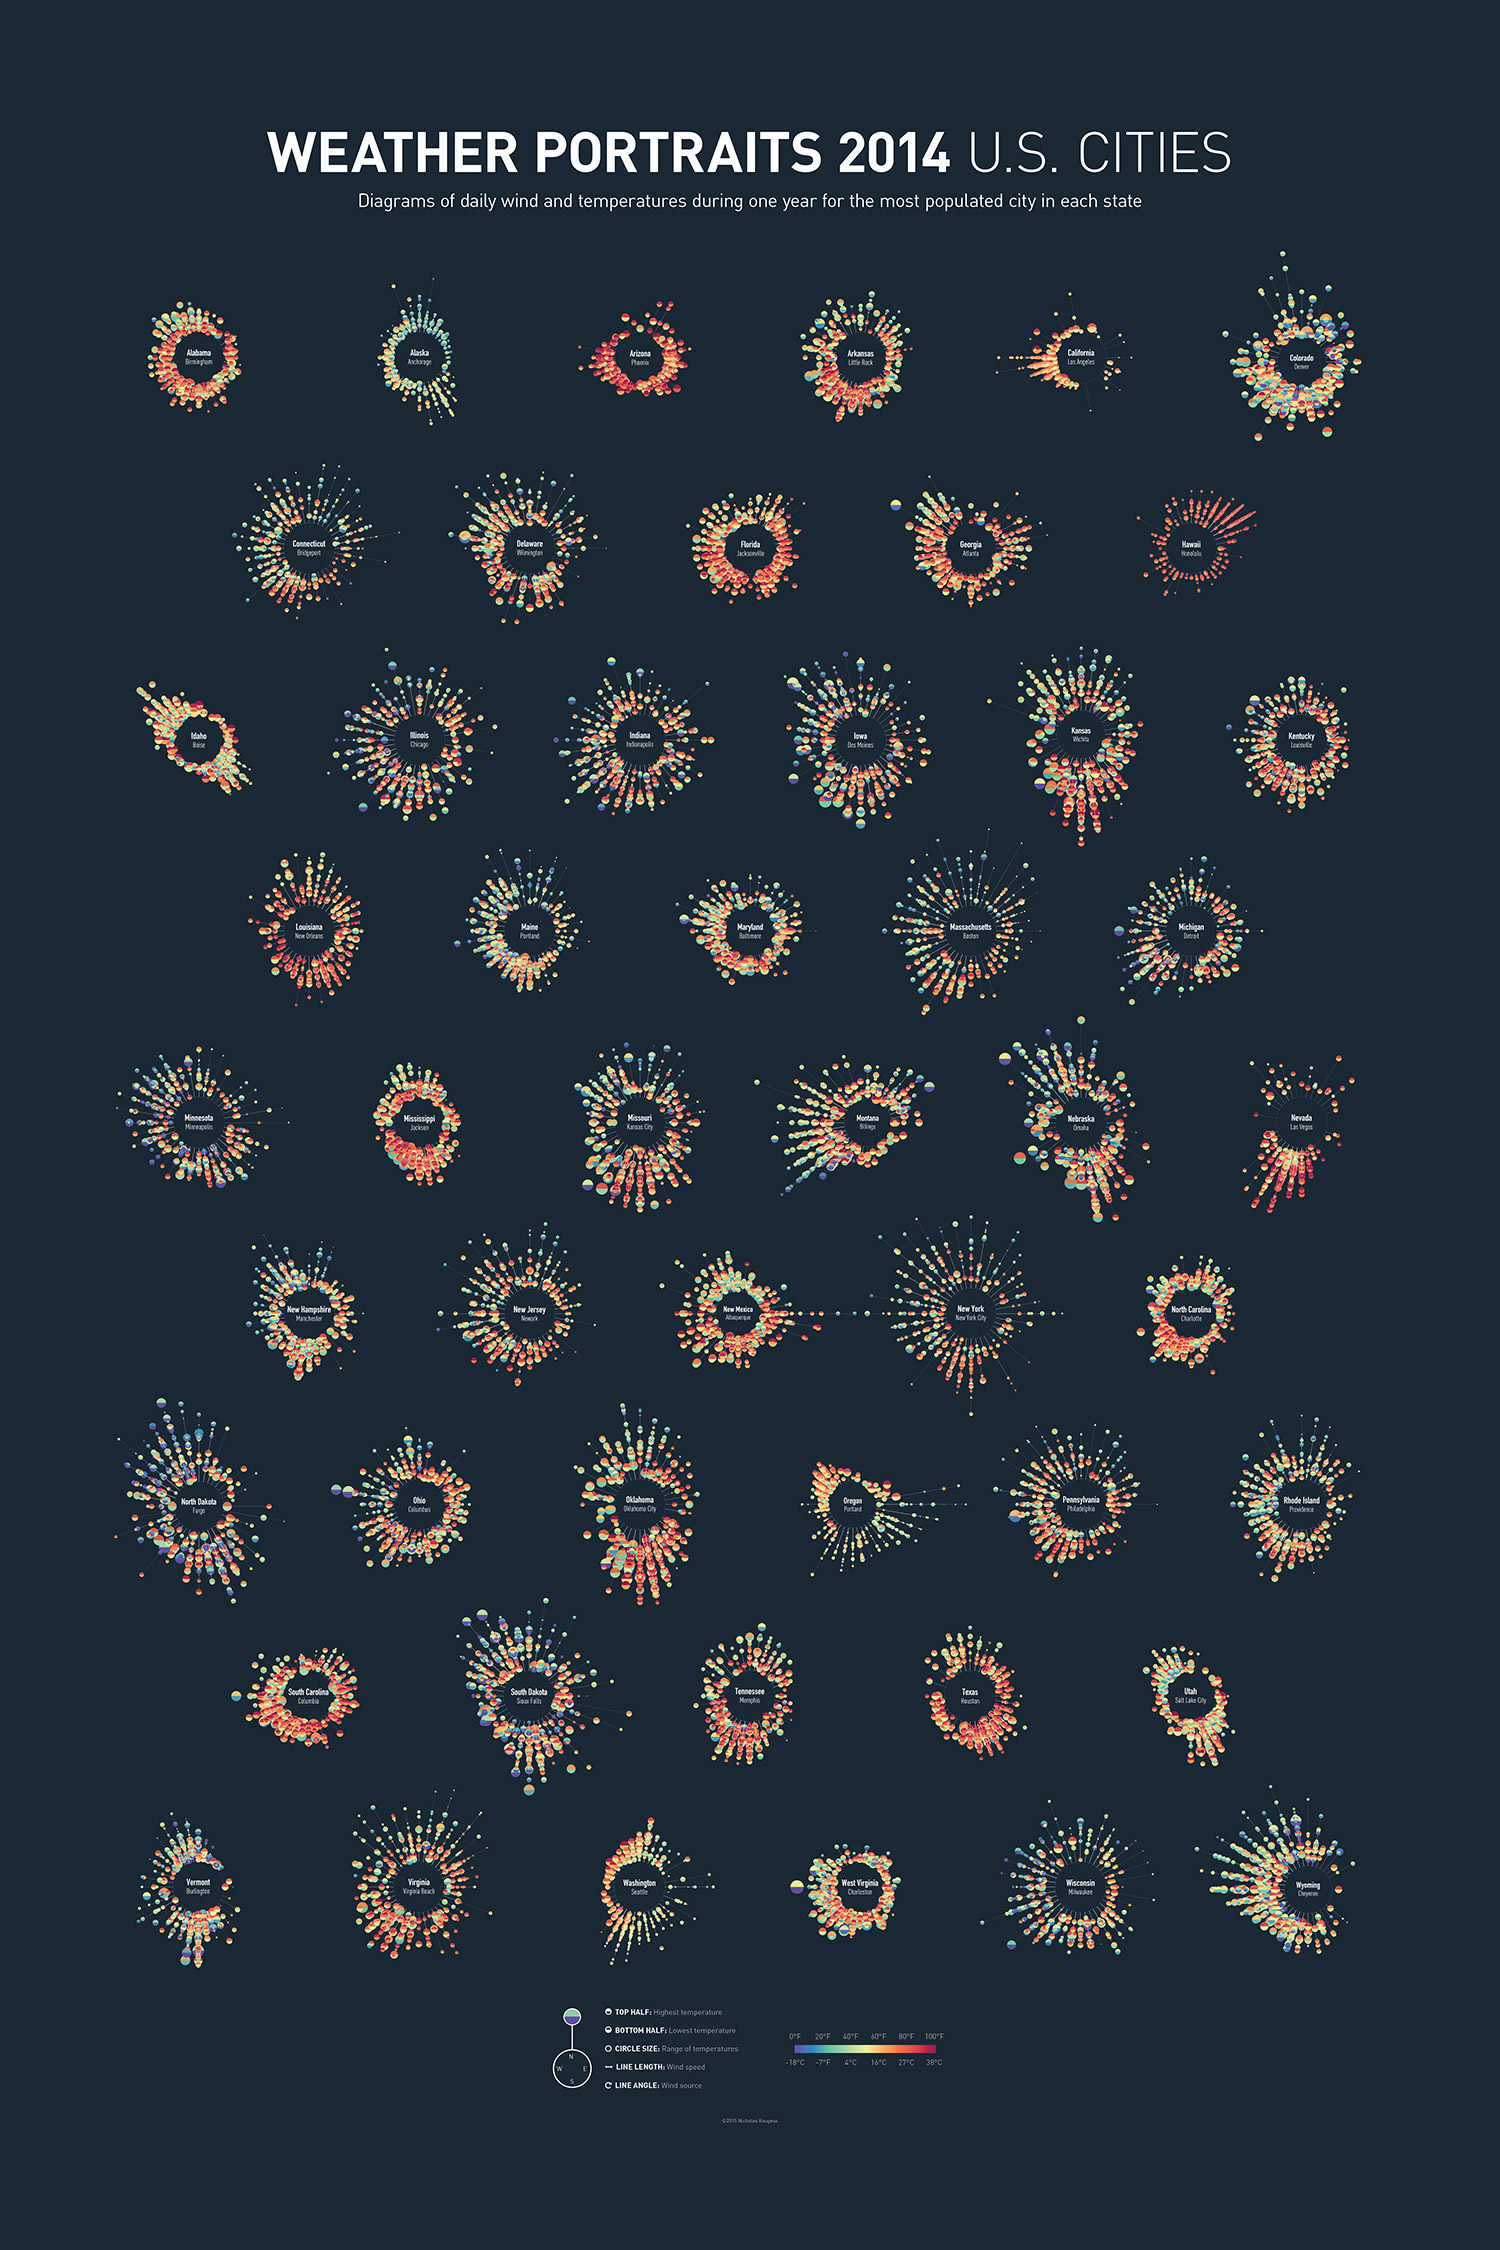
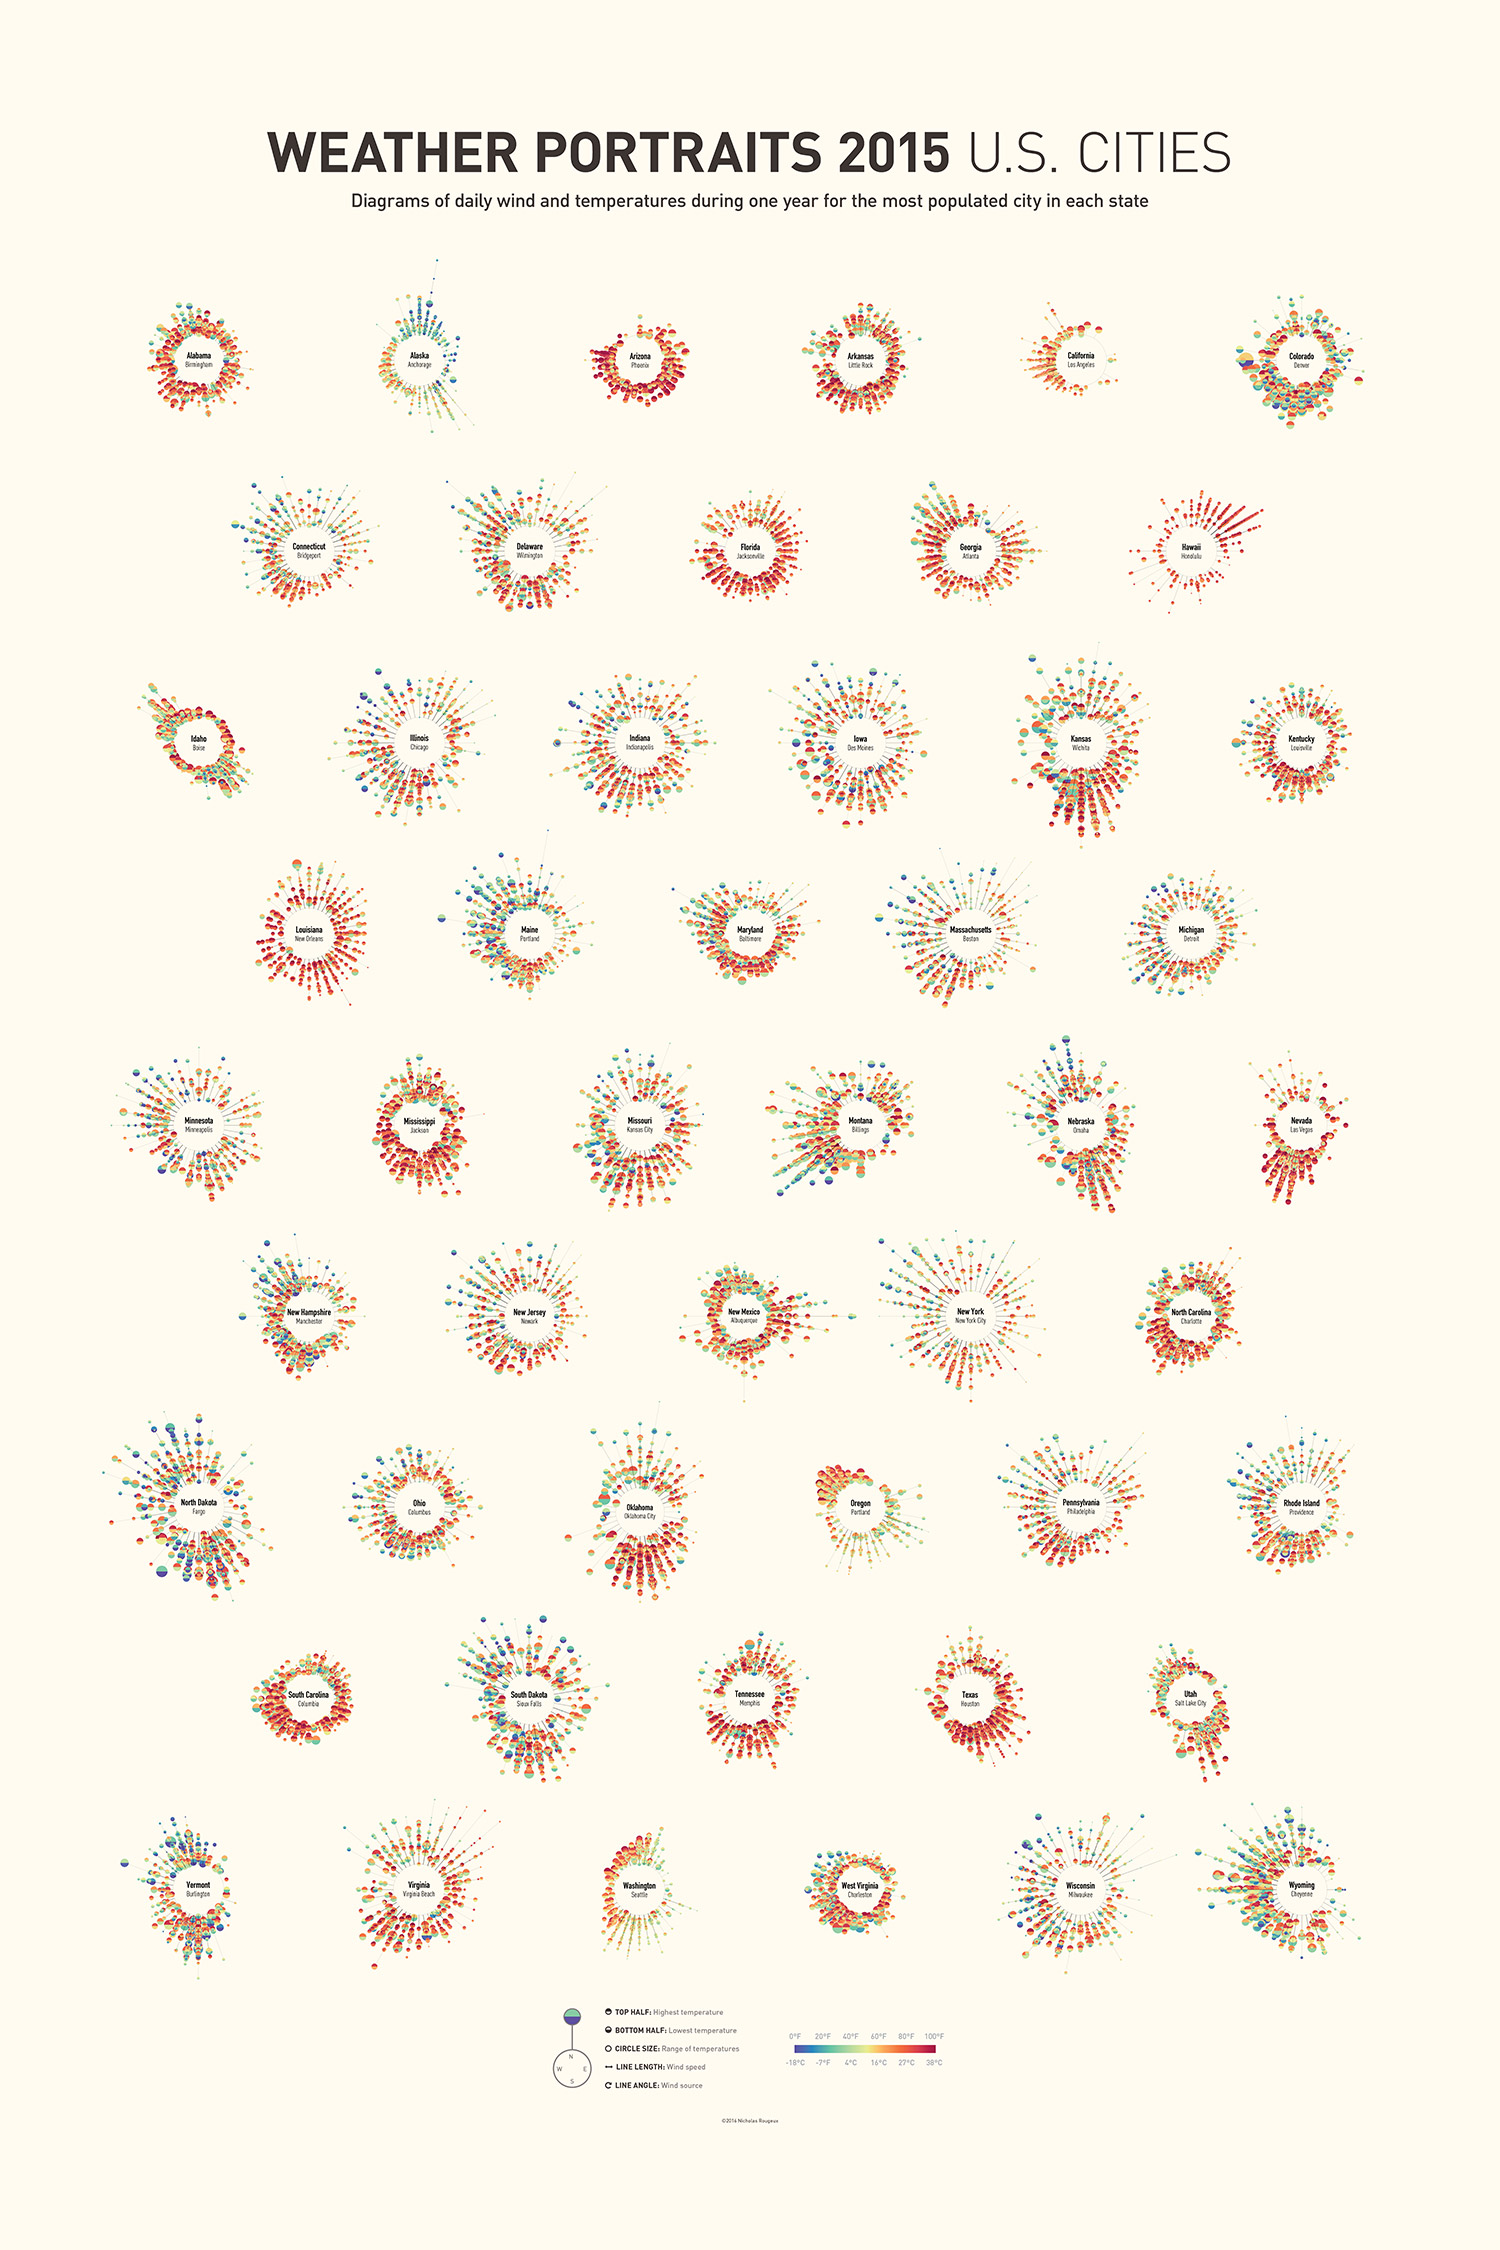
- 5 daily measurements
- 50 major cities
- 365 days
- 91,250 points of data
- 1 poster
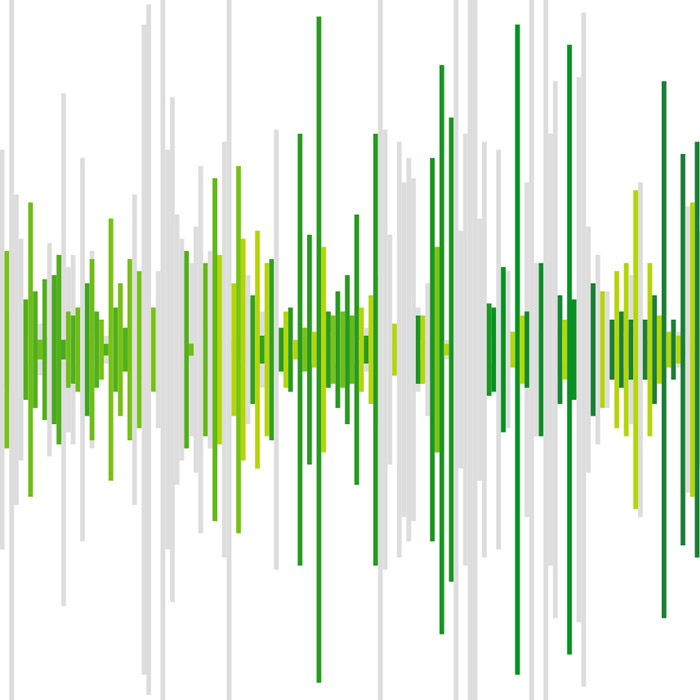
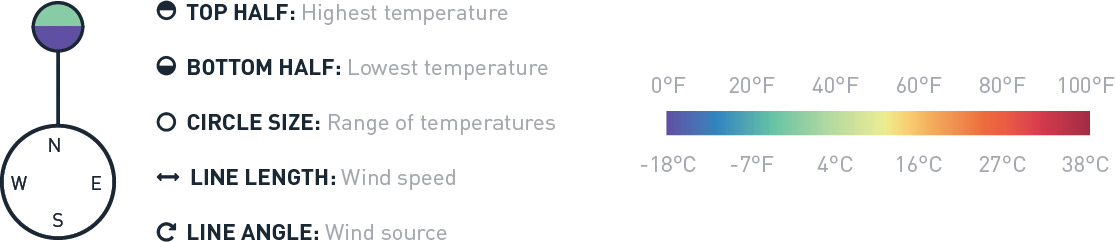
Colorful diagrams display five daily measurements for an full year in each city: wind direction, wind speed, high temperature, low temperature, and range of temperatures. Data were collected from the Quality Controlled Local Climatological Data (QCLCD) provided freely by the National Oceanic and Atmospheric Association (NOAA).
How to read it
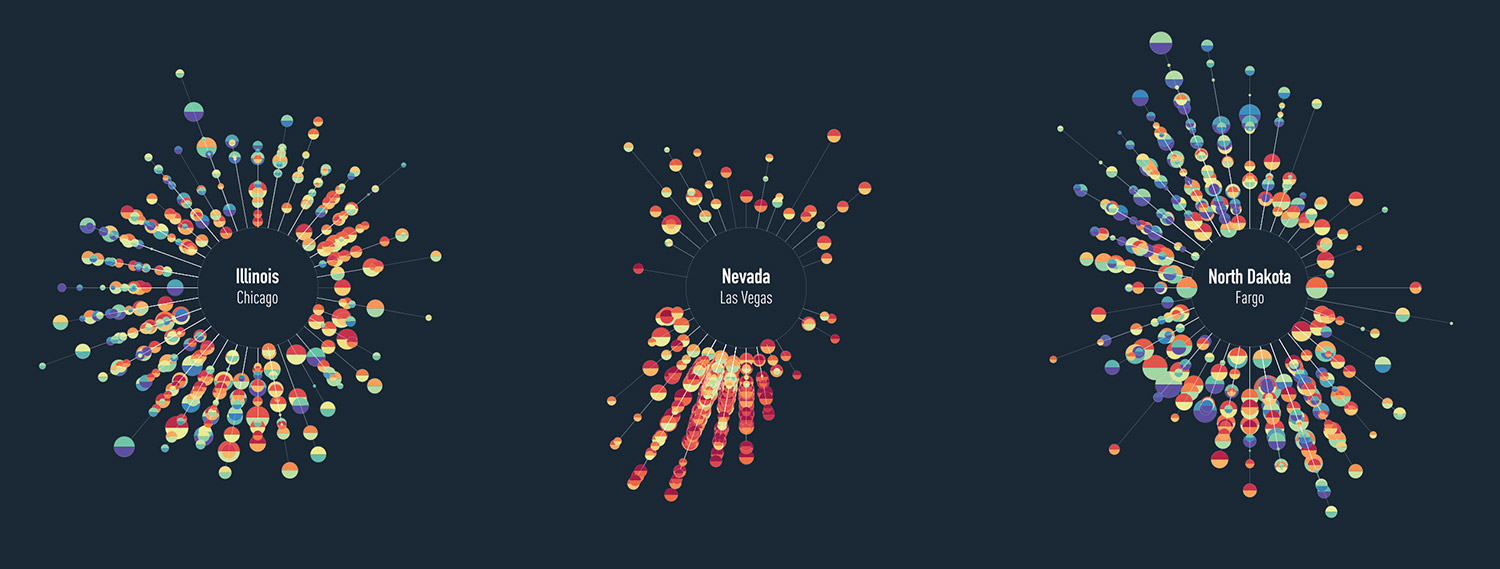
Each city is unique
Posters
Press
- Making of Weather Portraits, by Nicholas Rougeux, Jan 20, 2016, Visualoop
- Weather Portraits 2014 US Cities, Mar 3, 2016, Cool Infographics
- City Weather Patterns Explode into Colorful Visualizations in This Infographic, Apr 6, 2016, Visual News
- Weather was never portrayed like this, and we like it, August 8, 2016, Freepik Blog
- Social media finds, September 6, 2016, Information is Beautiful Awards
- Showcase, September 21, 2016, Information is Beautiful Awards 2016 Longlist
Published November 20, 2015