Featured
Latest from the blog
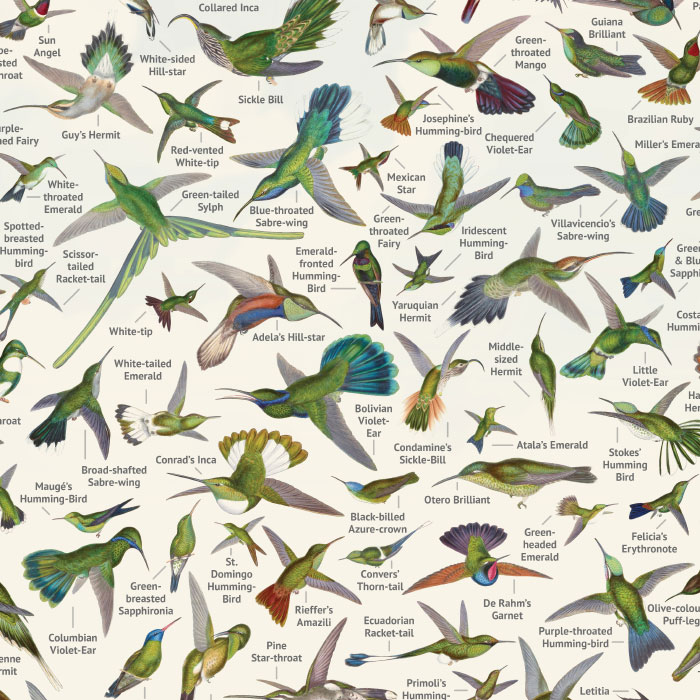
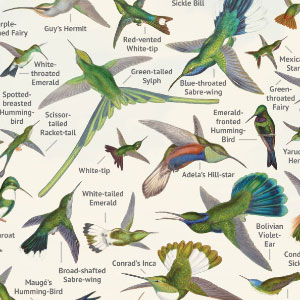 Making of Humming-Birds
- October 1, 2023
Hummingbirds are the closest living descendants of dinosaurs like the T. rex—one of many fascinating facts I learned while working on the digital edition of A Monograph of the Trochilidæ, or Family of Humming-Birds. Gaining unexpected knowledge has to be one of the best parts about working on a project.
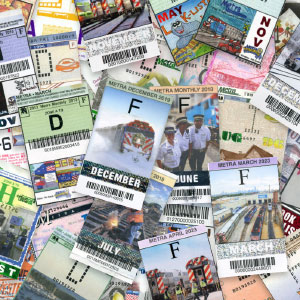 Metra ticket gallery updates
- August 27, 2023
Fifteen years have passed since the last official update on my Metra Ticket Gallery. An update is long overdue considering the number of tickets has grown dramatically to nearly 1,400. It’s about time I gave a new one about the latest additions and improvements.
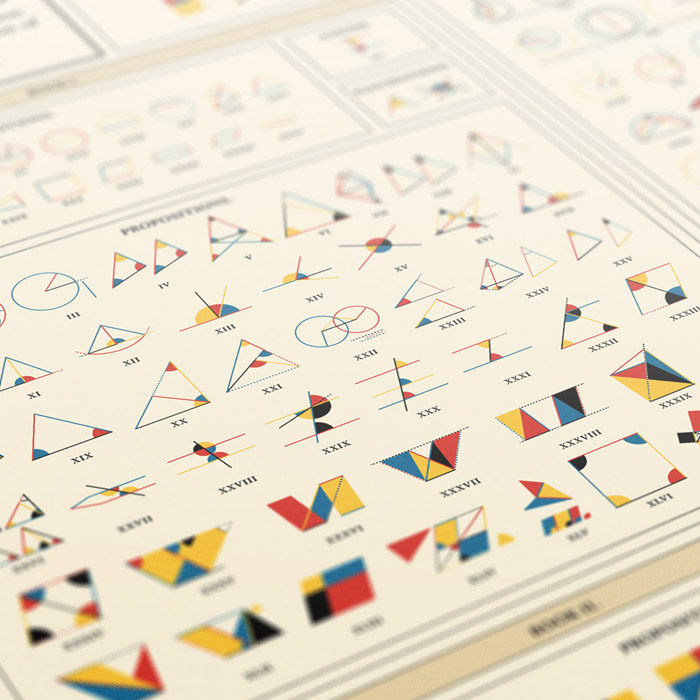
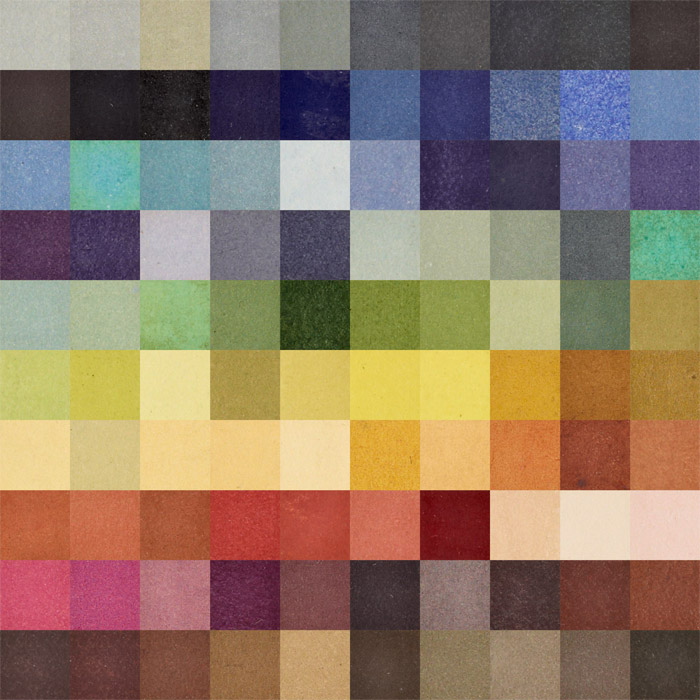
 Making of The Color Printer
- March 13, 2023
Unlike previous projects, I designed the poster based on Earhart’s 1892 treatise, The Color Printer before giving much thought to the design of the website. In fact, I wasn’t going to make a full digital edition but completing the poster made it so much more approachable and enjoyable.