Making of Between Stations
By Nicholas Rougeux, posted on September 24, 2017 in
I love transit data. After creating projects based on transit colors, stations, and lines, I figured it was time to create one based on the parts between the stations. The result was time-consuming but very interesting.
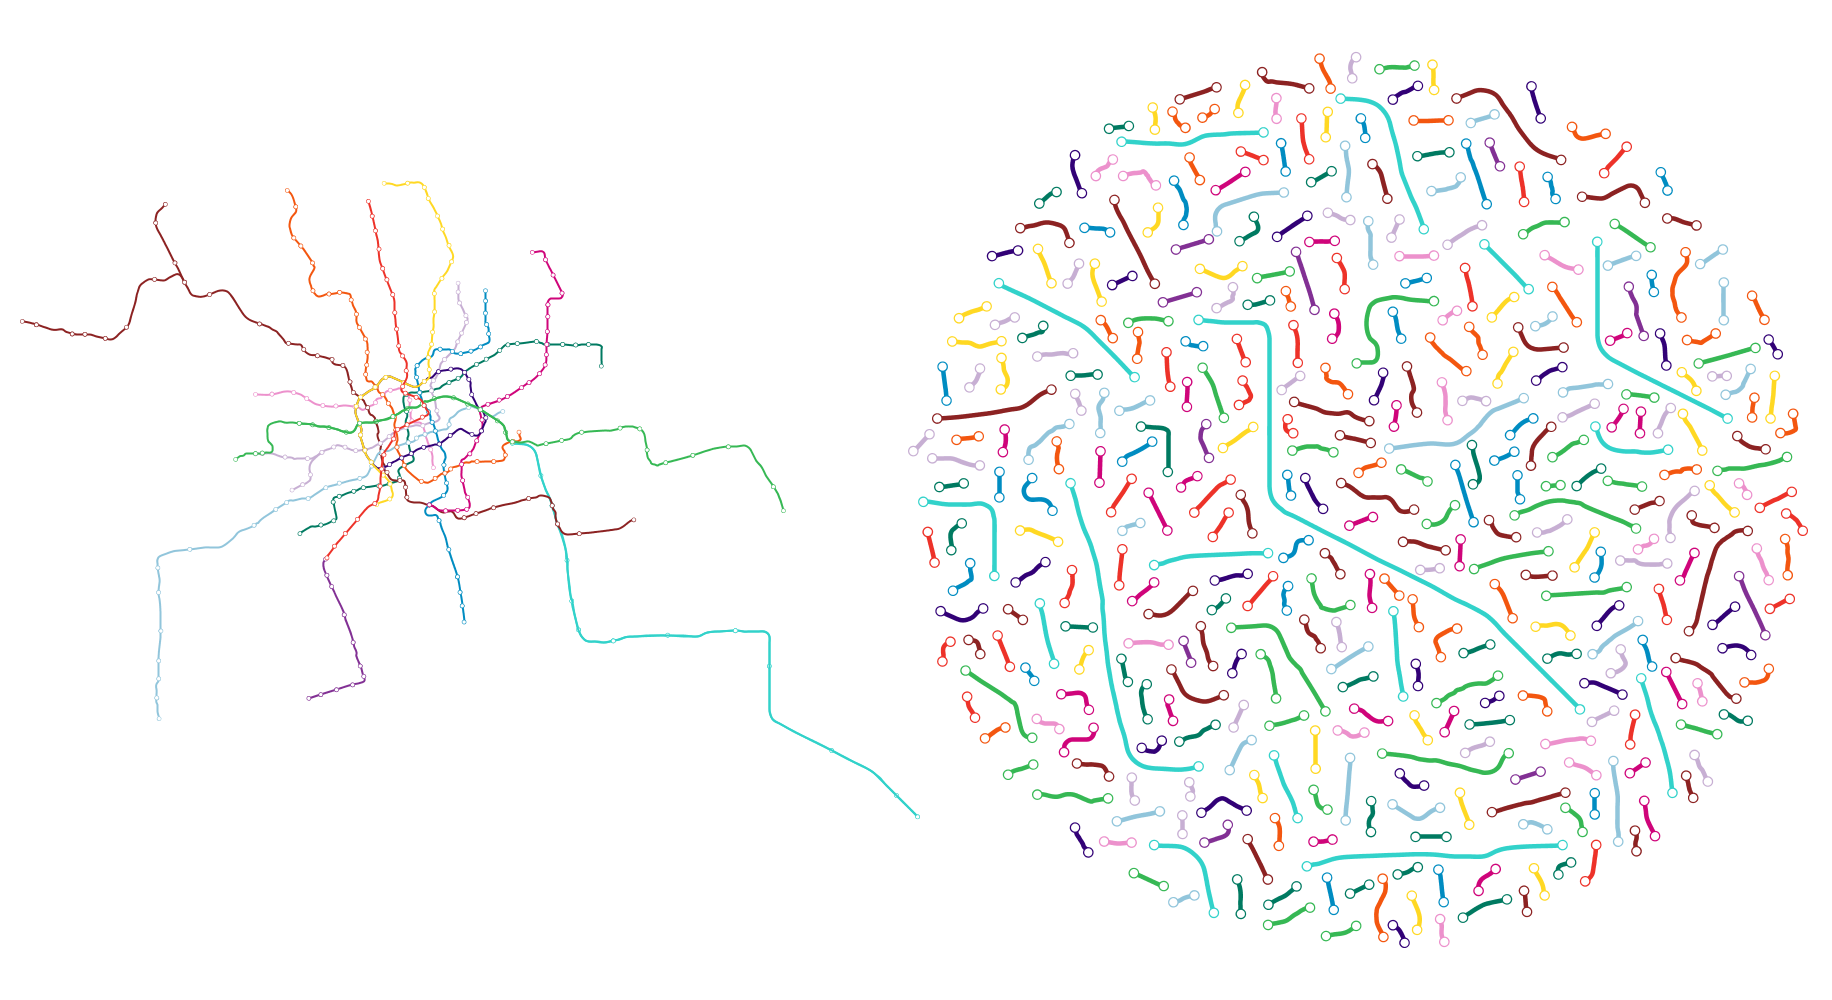
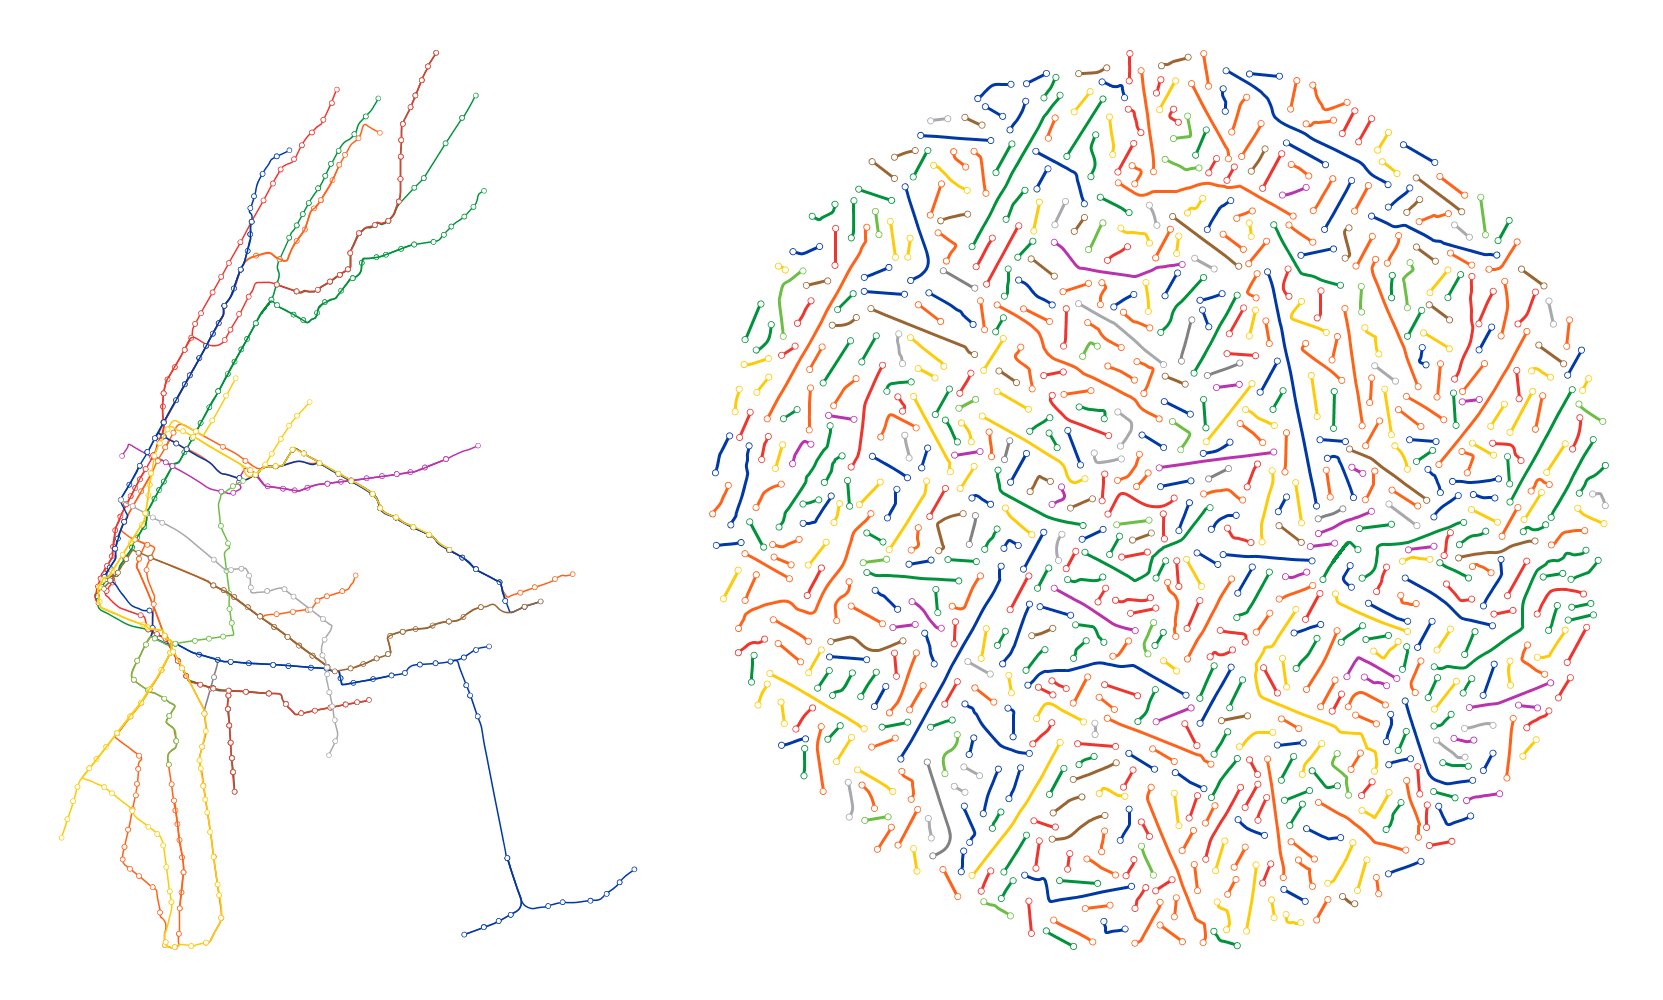
Between Stations explores the hidden shapes of subway systems between each stop. Maps of major subways systems were broken down into individual segments between each stop evenly spaced out in a circle by hand.
Data
Some cities had KML files of their subways readily available from their data portal or transit site (see Chicago, New York City, San Francisco, and Washington, D.C.). Not every city has a data portal so I exported KML files from Overpass Turbo, a web-based tool for downloading data from OpenStreetMap. (I last used Overpass Turbo for my Interchange Choreography project, colorizing interchanges.)
For example, I used the query below to get the entire London Underground and its stations:
[out:json][timeout:25];
// gather results
(
  node["railway"="station"]["network"~"Underground"]({{bbox}});
  way["line"~"Bakerloo|Central|Circle|Emirates|District|Hammersmith|Jubilee|Metropolitan|Northern|Piccadilly|Victoria|Waterloo"]({{bbox}});
  relation["line"~"Bakerloo|Central|Circle|Emirates|District|Hammersmith|Jubilee|Metropolitan|Northern|Piccadilly|Victoria|Waterloo"]({{bbox}});
);

// print results
out body;
>;
out skel qt;
Similarly, the query below gets all the data for the Shanghai Metro:
[out:json][timeout:25];
// gather results
(
  node["subway"="yes"]({{bbox}});
  node["public_transport"="stop_position"]["highway"!="bus_stop"]["bus"!="yes"]({{bbox}});
  way["name"~"Metro"]({{bbox}});
  relation["name"~"Metro"]({{bbox}});
);

// print results
out body;
>;
out skel qt;
Subway lines for every city were coded slightly differently so a different query had to be crafted for each one to get all the lines and stations. I'm sure there are more efficient methods but this was my first real attempt at using queries to get specific data. To use these, just copy and paste them into the sidebar on Overpass Turbo and click Run.
Once KML files were exported from Overpass Turbo, I converted them to SVG files using GPS Visualizer. While the KML files were geographically accurate, they included extra data that I couldn't exclude with a query so the SVG files generated from them were pretty rough and needed a lot of cleanup to prepare them for creating the final diagrams in Illustrator.
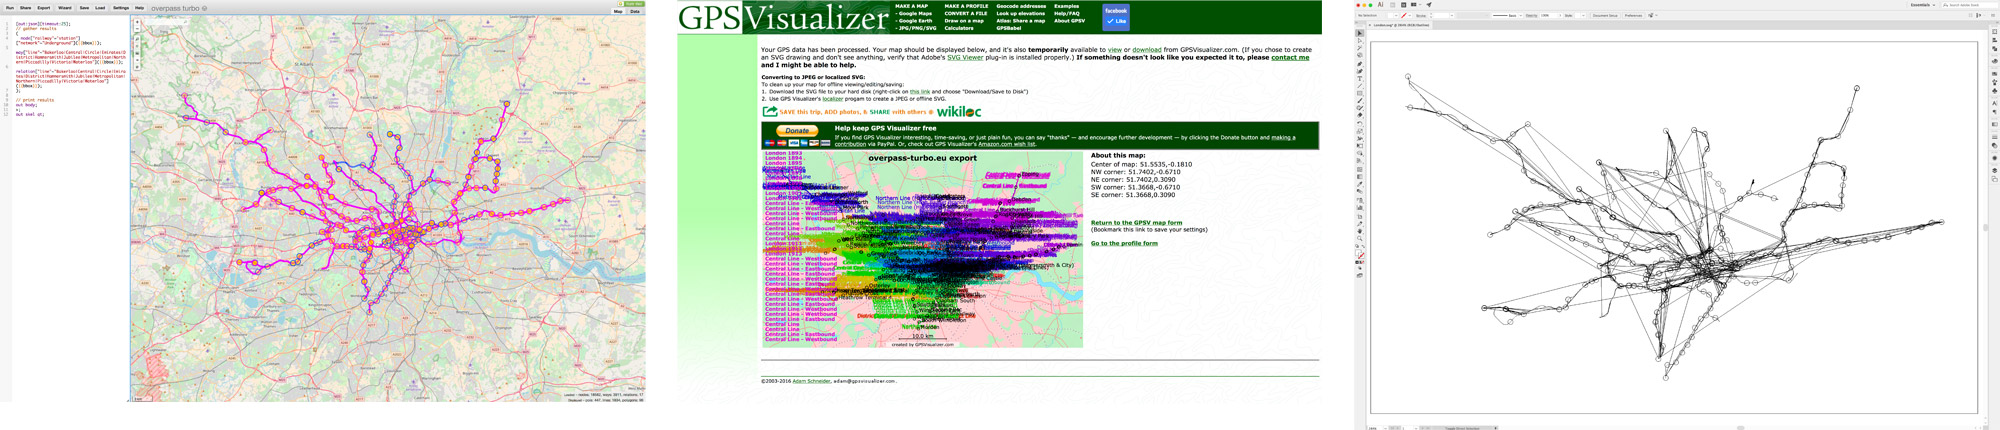
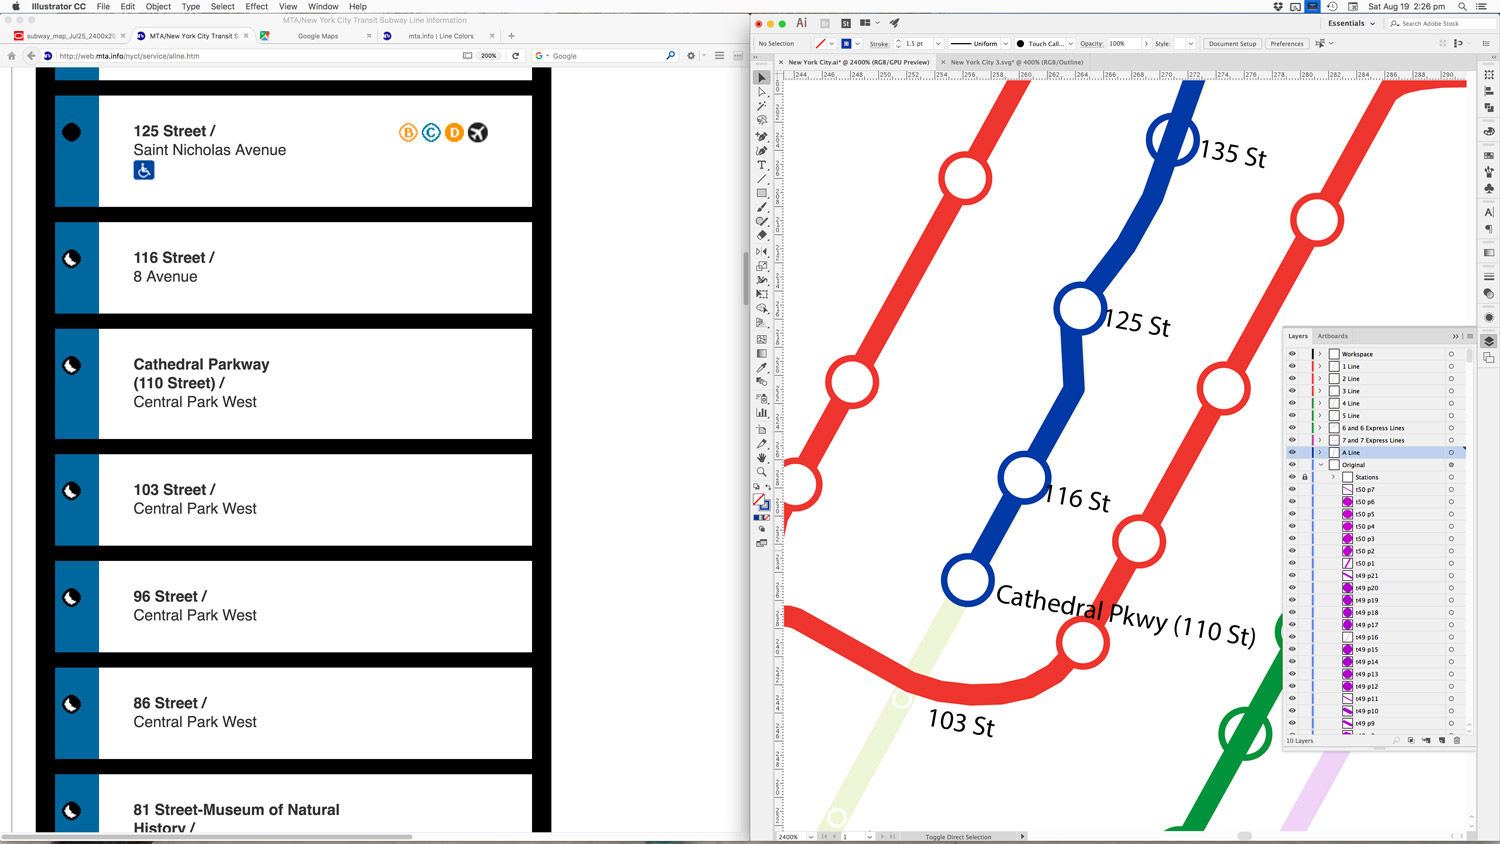
Extracting data for KML from Overpass Turbo (left), converting KML to SVG in GPS Visualizer (center), and viewing resulting SVG in Illustrator in outline mode (right)
Cleanup
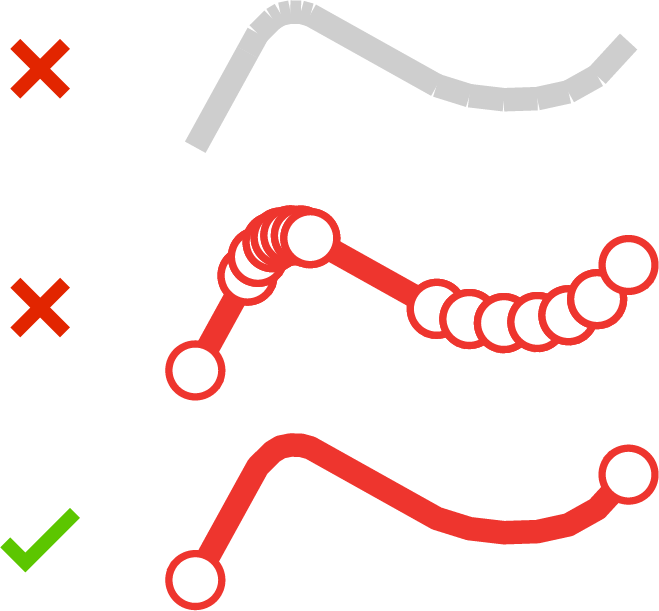
Raw data includes separate shapes for each line in a path as shown at the top for the segment between 96 Street and Central Park North (110 Street) in New York City. Applying the line style to segments as they are doesn't work (middle) so they need to be joined in Illustrator to form one continuous segment (bottom).
Cleaning up the shapes was easily the most time-consuming part of this project for several reasons:
- Raw data exported from OpenStreetMap is very detailed and includes lines for each track so every segment between stations comprised two or three lines very close to each other (e.g. inbound and outbound tracks). These needed to be simplified to just one line for every segemnt.
- Raw data also has separate shapes for everything so what may appear as a single line is actually separate lines in a group that need to be joined in Illustrator to form a single line.
- I wanted the original data to be preserved as much as possible so I could know which segments were which afte rearranging them. Every segment is grouped by line and named in Illustrator as layers based on the stops at either end.
I cleaned up shapes by completing the following process for each subway line:
- Add temporary labels next to each station for reference—using system maps, Google Maps, and Overpass Turbo for reference. (This was easier than bouncing back and forth between Illustrator and reference maps later on.)
- Remove extra lines and shapes for tracks.
- Join separate lines between stations into segments, apply appropriate the appropriate styling, and create name based on station endpoints
The following screenshots show parts of the process when I cleaned up files for New York City and London.
Referencing the A line while cleaning up New York.
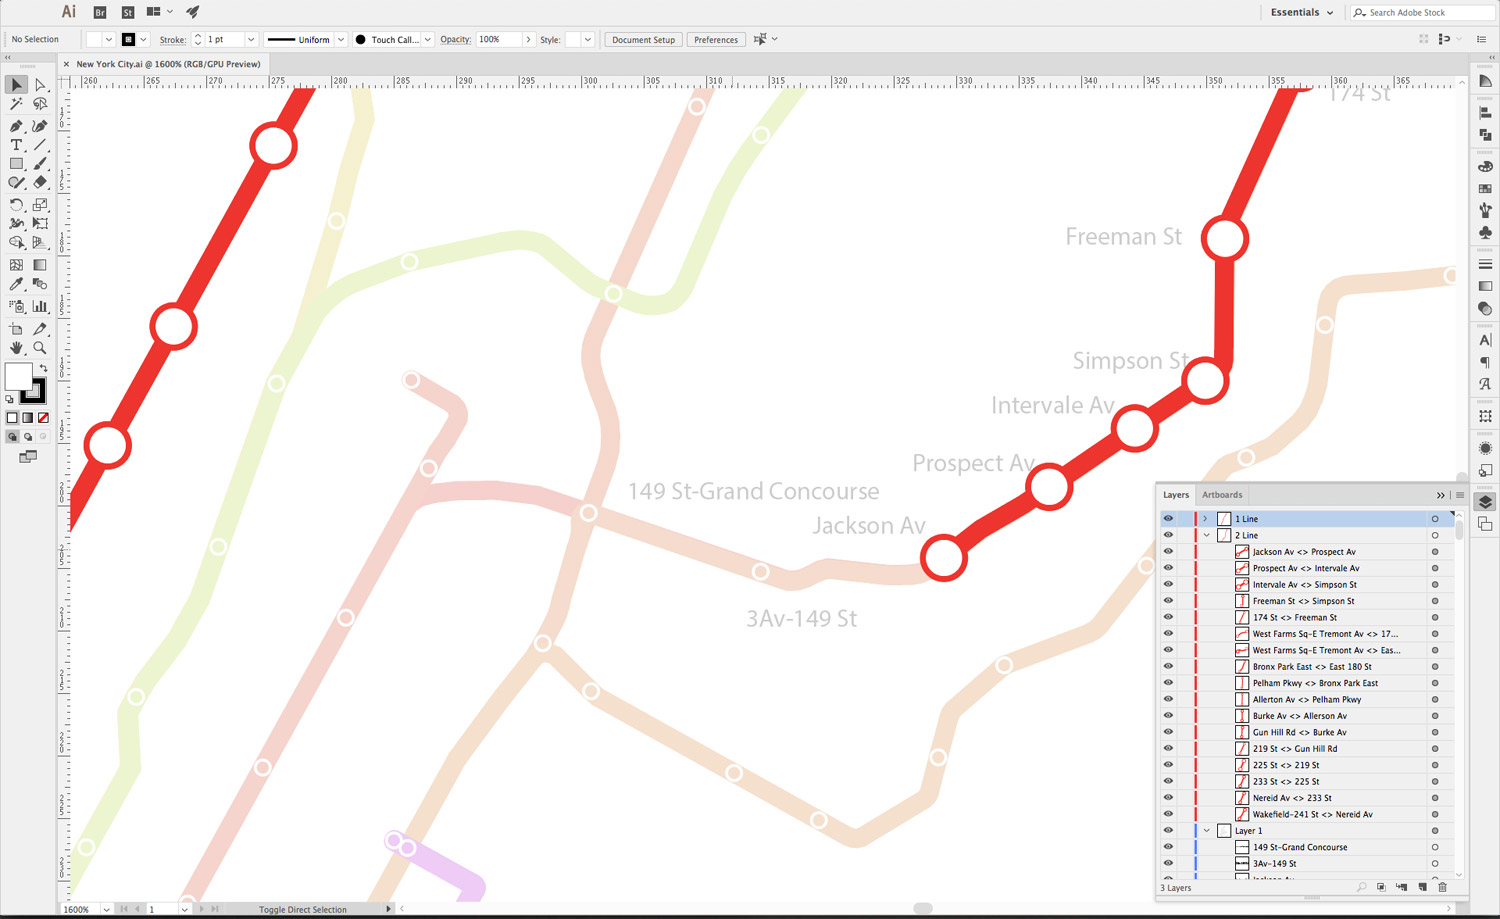
Cleanup up the 2 line in New York. Each segment is named based on its station endpoints.
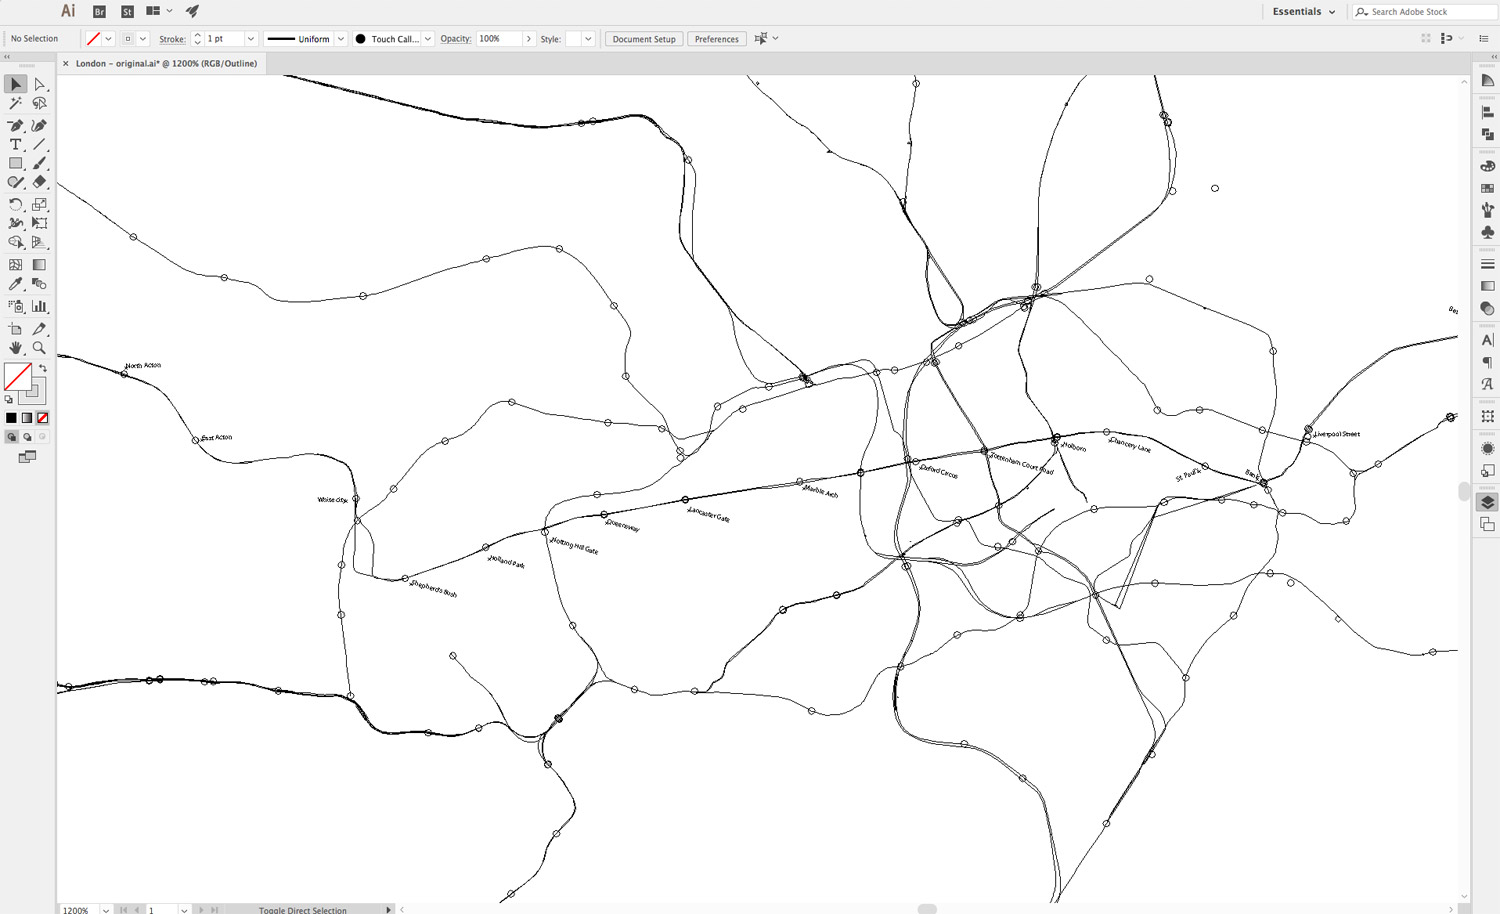
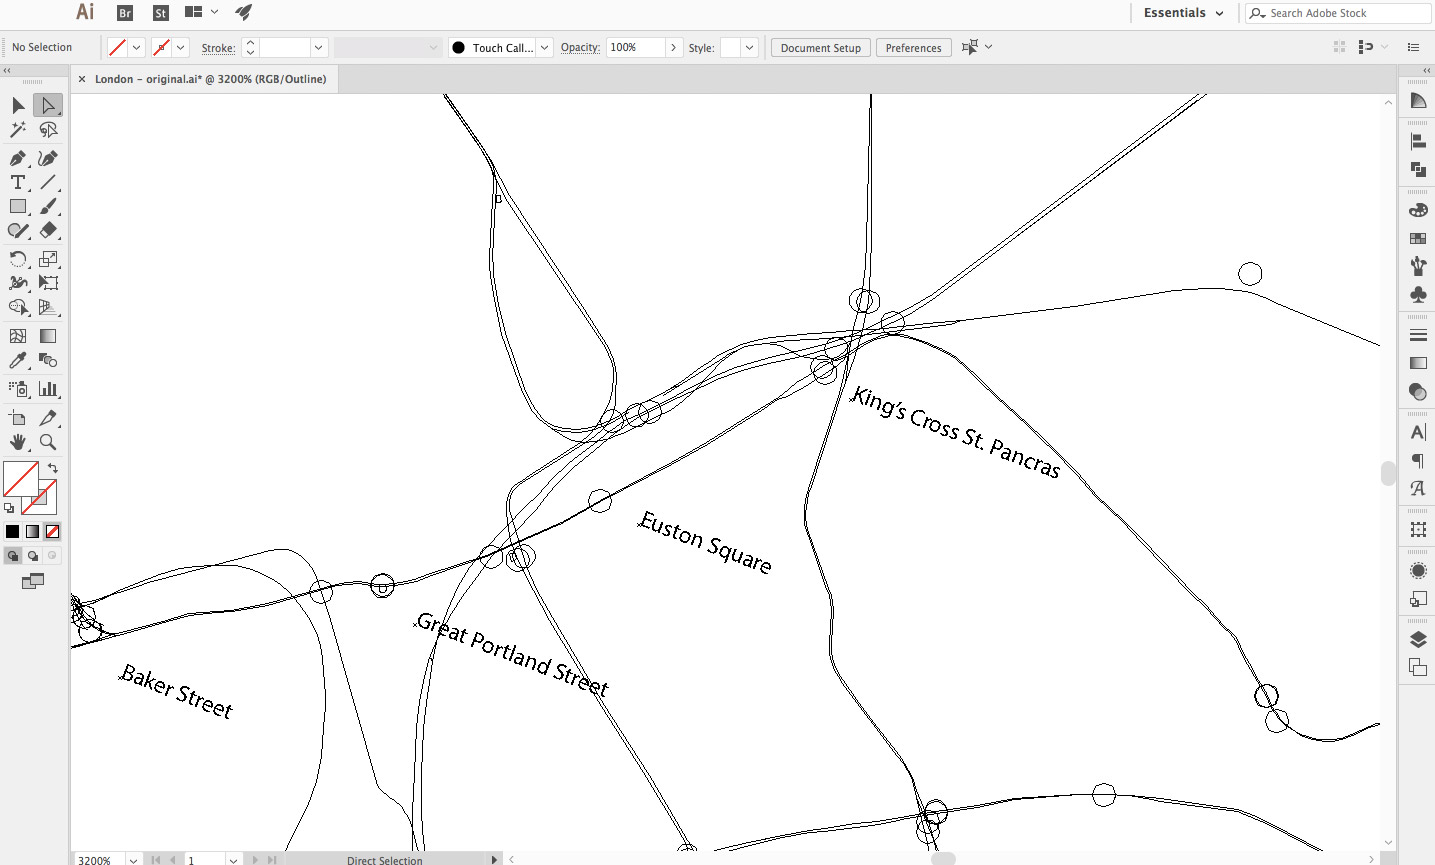
Outline mode of a busy area around King's Cross in Illustrator while cleaning up London.
Outline mode during an initial pass of labeling stations for the Central Line in London.
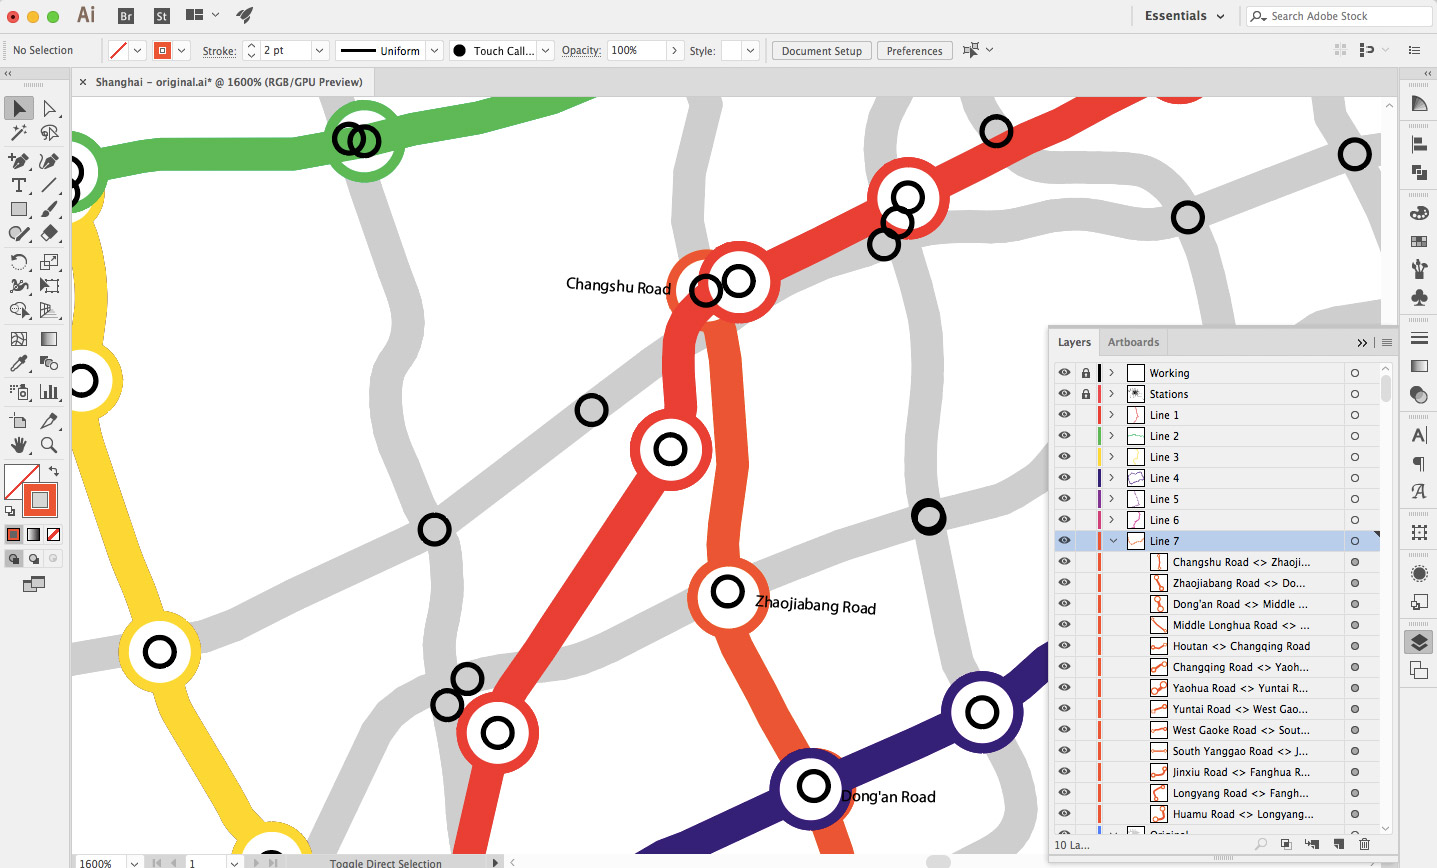
Building the 7 Line in Shanghai.
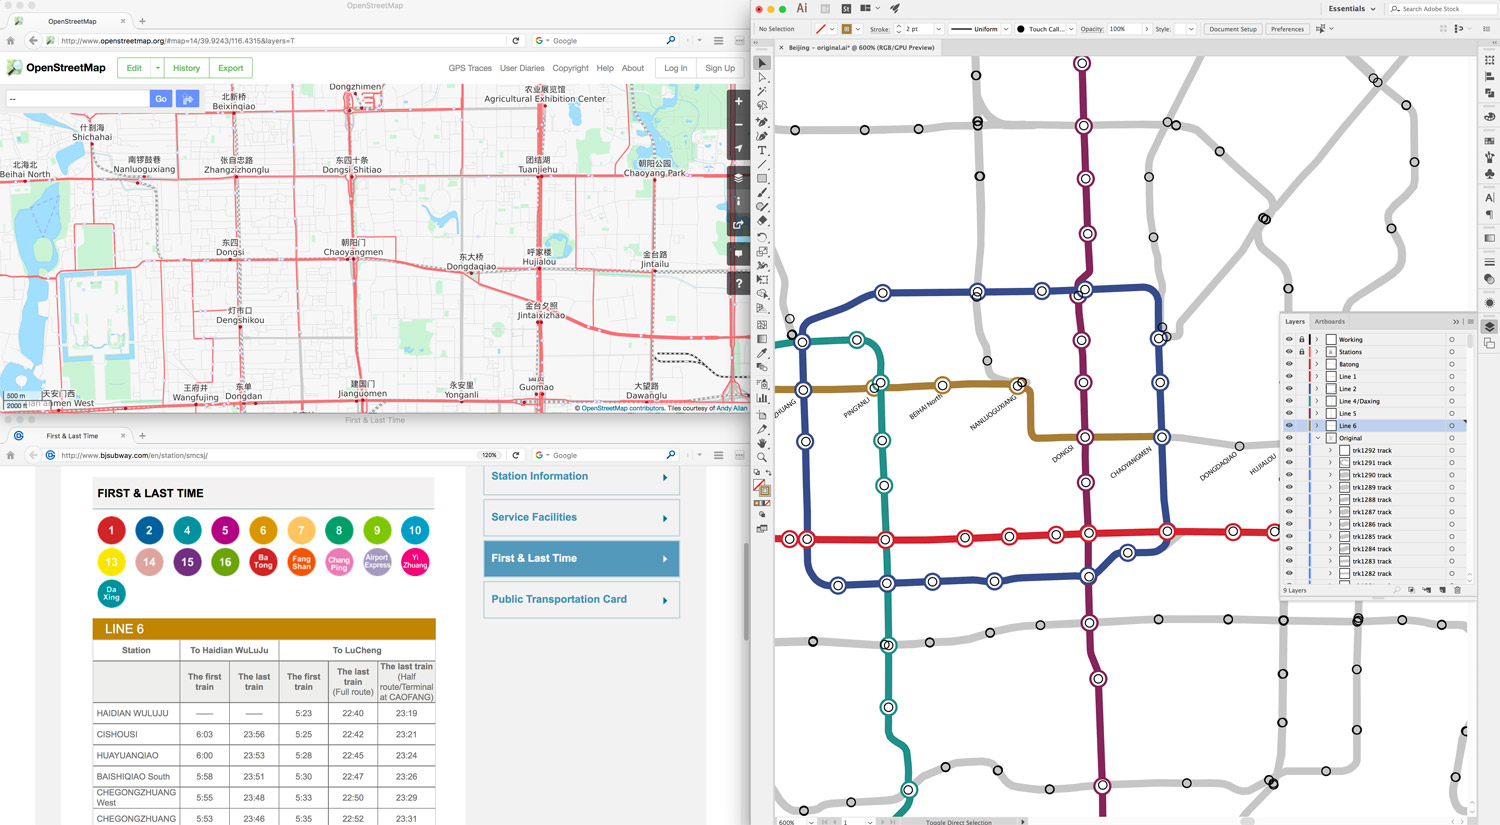
Building Line 6 (tan line) in Beijing. OpenStreetMap is in the upper left for reference, the Beijing Subway website with stations for Line 6 is in the lower left, and Illustrator is on the right.
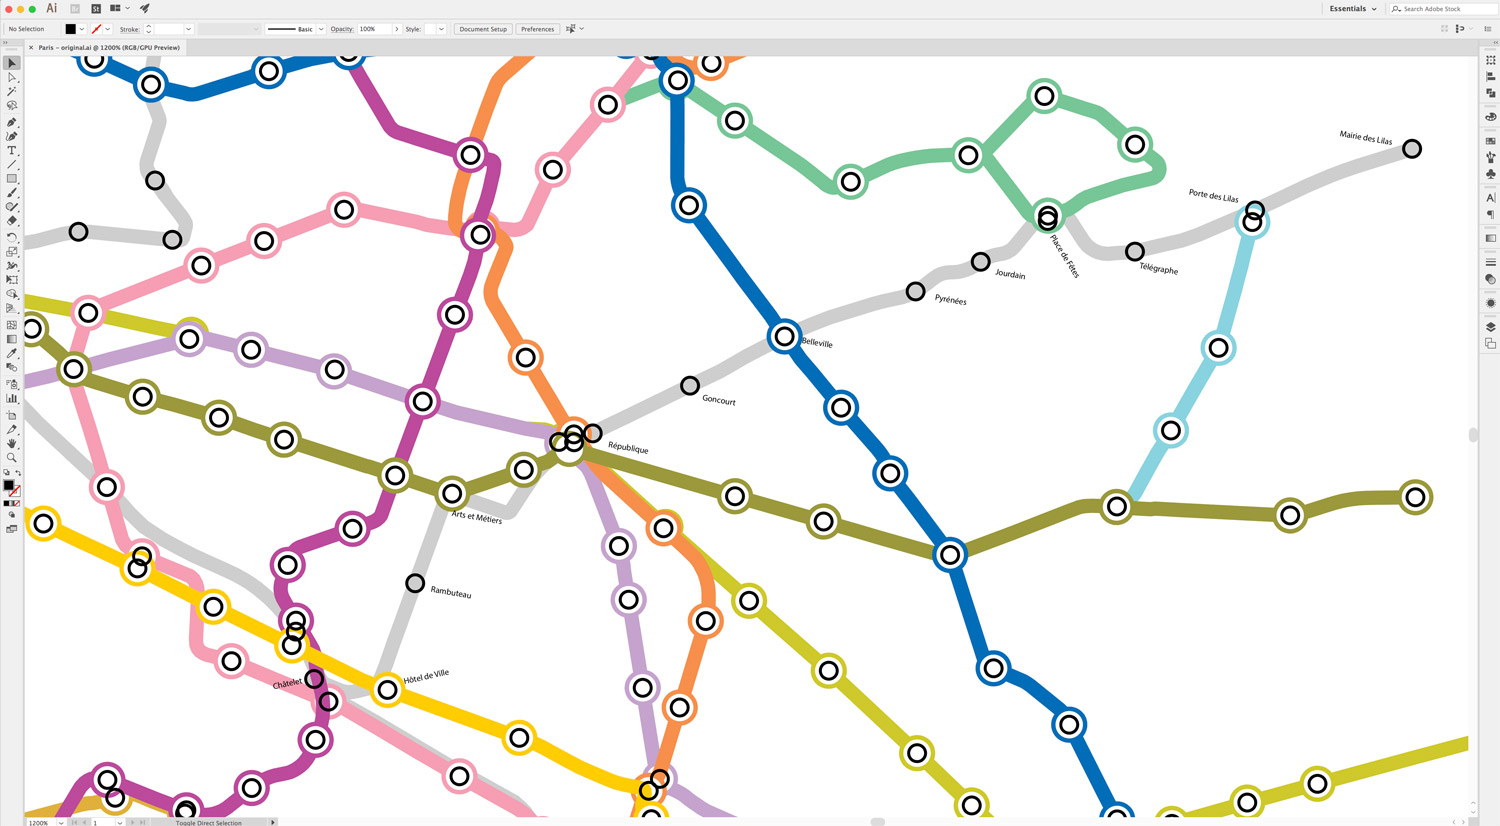
Reference labels placed for Line 11 in Paris in preparation for coloring.
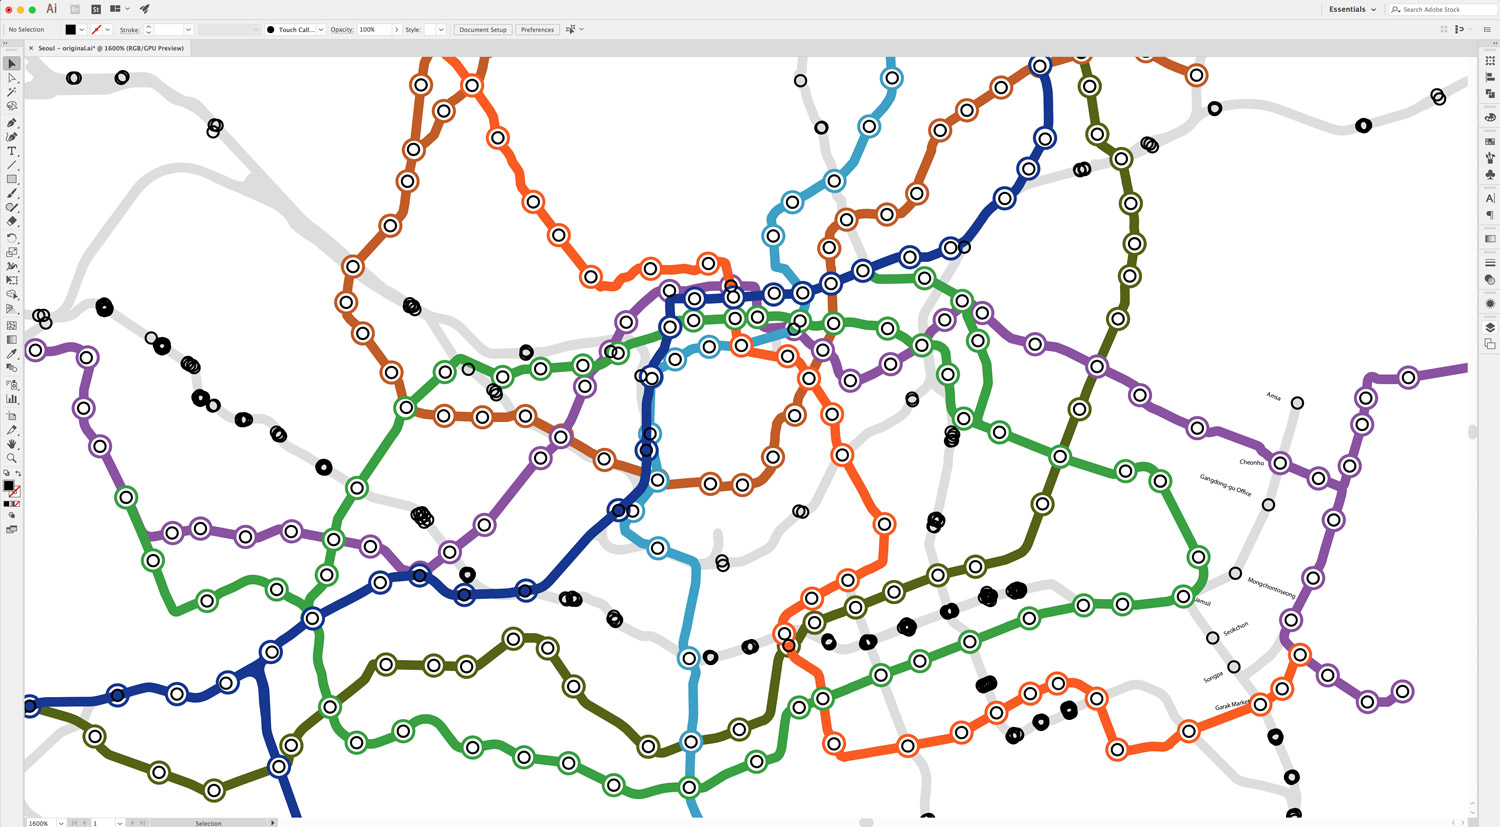
Closeup of cleaning up the heart of the Seoul Metro with Lines 1–7 completed and the first few reference labels of Line 8. The Seoul Metro was the largest and most time-consuming to clean up resulting in 756 separate segments.
Design
I wanted to be sure every segment of an entire subway line was included but that could have meant different things. How should segments that serve multiple lines be handled like in the Chicago Loop where serves four or five different lines are served per segment? How about in New York where several segments serve multiple services like 1, 2, and 3 but only one line like the IRT Broadway-Seventh Avenue Line?
I decided to base the decision on lines that were differentiated by color so lines of different color would be included but not those that share the same color. For example, in Chicago, the segment between Washington/Wells and Quincy serves three lines: Blue, Purple, Orange, and Pink; so a segment of each color is included in the final image. However, in New York, the segment between Fulton Street and Wall Street are served by the 2 and 3 services which are part of the overall IRT Broadway-Seventh Avenue Line, so only one segment is included on the final image.
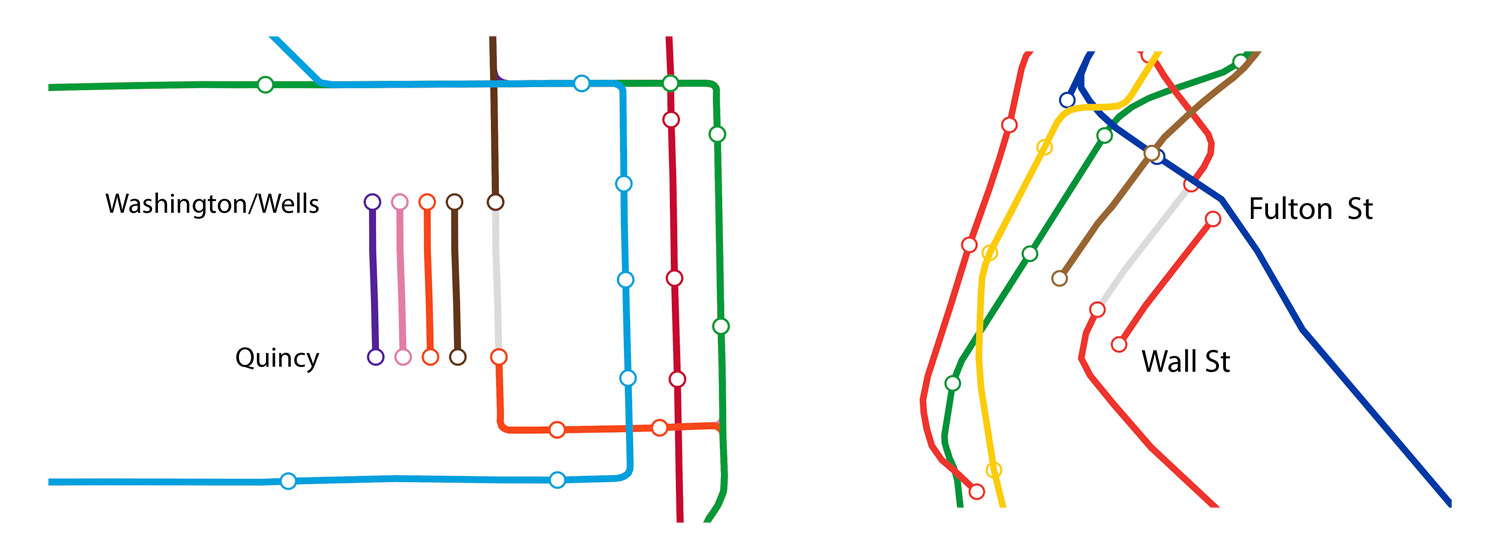
Separate segments were created for each line serving a line such as in Chicago (left) and but only one for those serving multiple services of the same color as in New York (right).
However, since the project was about every segment between stations, I also included segments that skipped stops because they are additional segments. For example, in New York, a train goes from Penn Station to 14 Street but also stops at three stations in between. So there are five segments included: one for the longer stretch and four for each stop between.
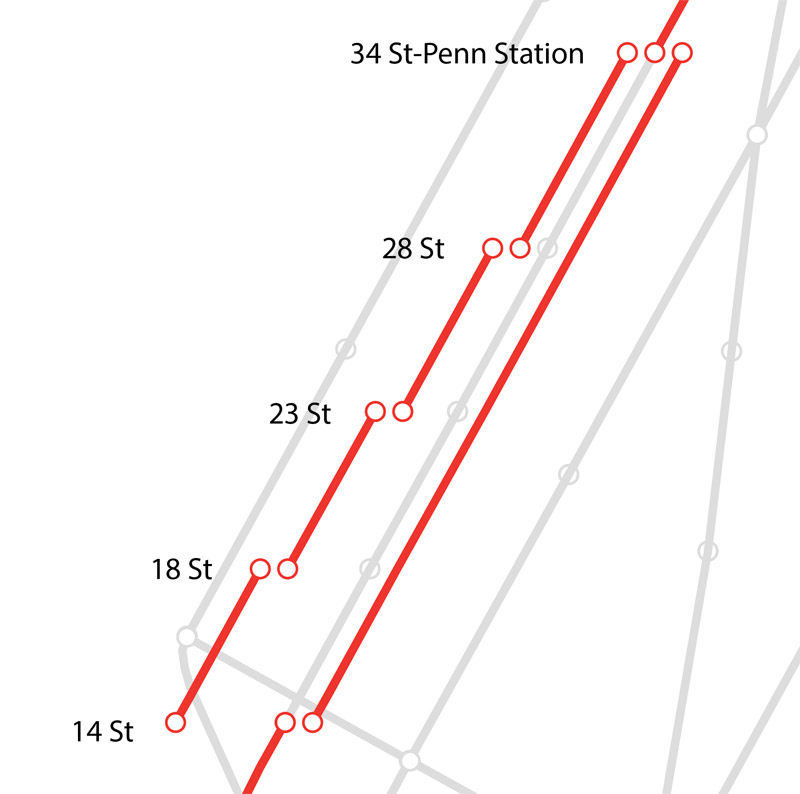
The different segments between 34 Street-Penn Station and 14 Street
I felt including geographically accurate segments was important because they're better representations of the actual system. The stylized wayfinding maps we are all familiar with would have worked as well but they're also under copyright. Geographic data isn't under copyright. To remain true to the accuracy, each segment in the diagram is not rotated to fit. They're all kept the same orientation as the original subway map.
Once I nailed down my criteria, I had to find a way to evenly space out all the segments into a single shape—also known as "packing." This presented a challenge because as far as I could tell, no reliable way exists to fit an arbitrary number of irregular shapes into another. Lots of research has been done for regular shapes (e.g. circles within a circle), but finding an efficient solution to packing irregular shapes remains elusive.
Knowing that, I chose the manual route. Each segment was placed one a time—starting with the larger segments and ending with the smallest. This process worked well because there was always room for smaller shapes after the larger ones were placed. I determined which were larger by simply aligning all segments in Illustrator—creating what I affectionately called the hairball. Below is an animation of the evolution of the New York diagram. I took the longest segments from the hairball on the right and placed them in the circle on the left. Surprisingly, only minimal adjustments were needed even though 649 segments were placed.
Placing all segments in the New York diagram from the aligned "hairball" on the right to the final diagram in on the left.
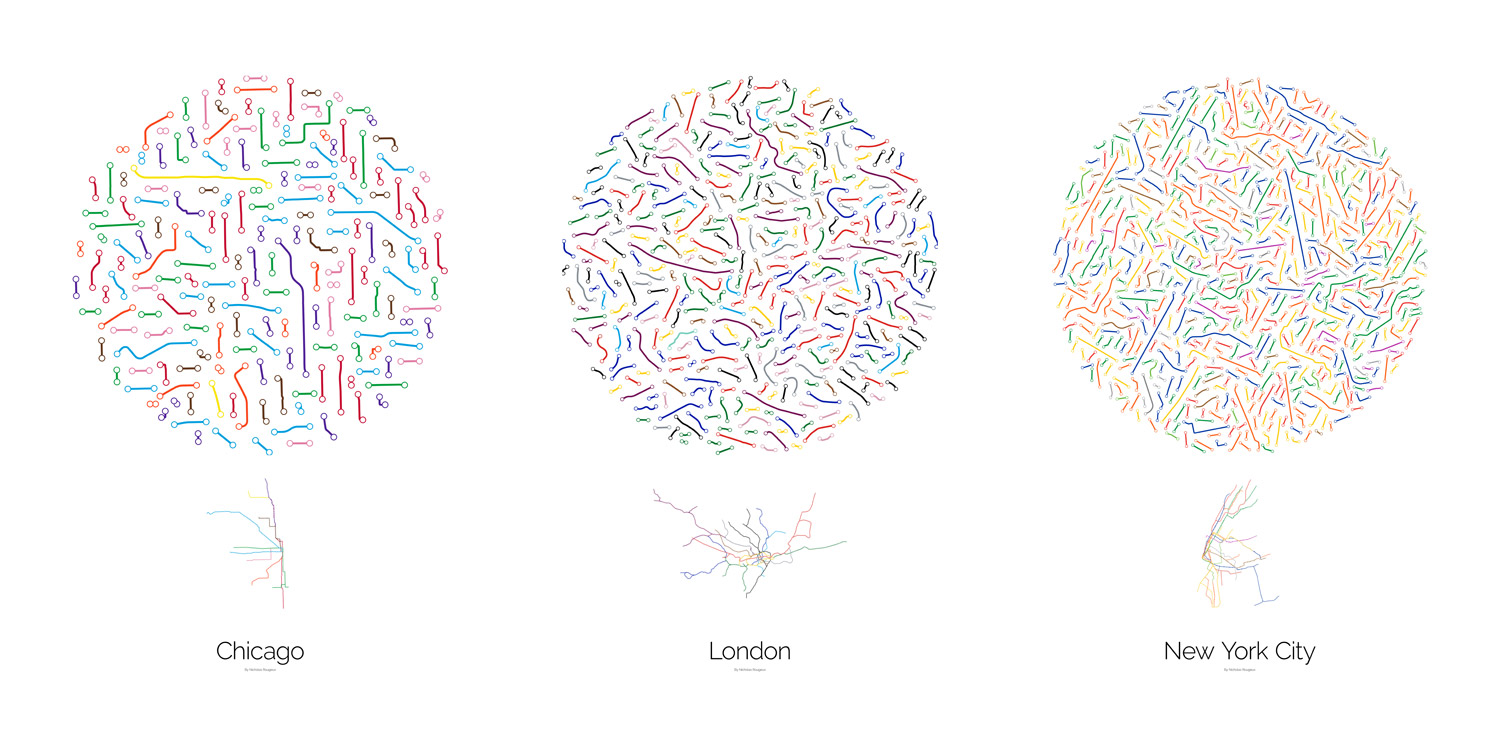
Arranging the segments this way reveals geographic identities unique to each city. For example, Chicago is a grid-based city from north to south and east to west so its diagram has more mostly horizontal and vertical segments while London's segments appear more curved because the city's layout is less ridgid. New York City's layout has grid-based areas but they're on an angle from true north, so most of the lines are diagonal.
Creating the animations that show every segment flying between the map and the diagram was another adventure. I originally wanted to export SVGs from Illustrator and animate them with D3 but opted not to becuase I didn't have the knowhow and patience to cobble something together and animating hundreds of objects at once would likely cause performance issues—especially on mobile devices. Instead, I chose the more challenging option of using NodeBox—though I wouldn't find out how challening until later.
NodeBox's animation capabilites are not nearly as advanced as other tools. Everything is based on what frame is being displayed so the position and size of every segment had to be determined at any given frame. It has no notion of a timeline or scheduling movement. Ater much head-scratching and frustration, I successfully created a way to move the segments back and forth. Plus, it's flexible enough to allow me to change how long the animations are and even how much they're staggered when moving back and forth. Individual frames of the animation were exported from NodeBox and then combinedin Photoshop to create the final GIF animations. The final diagram is below. It's too complex to go into here but I offer it up as a kind of trophy for figuring out a very challenging task. I'm sure it could be done more efficiently but it works and I'm proud of it.
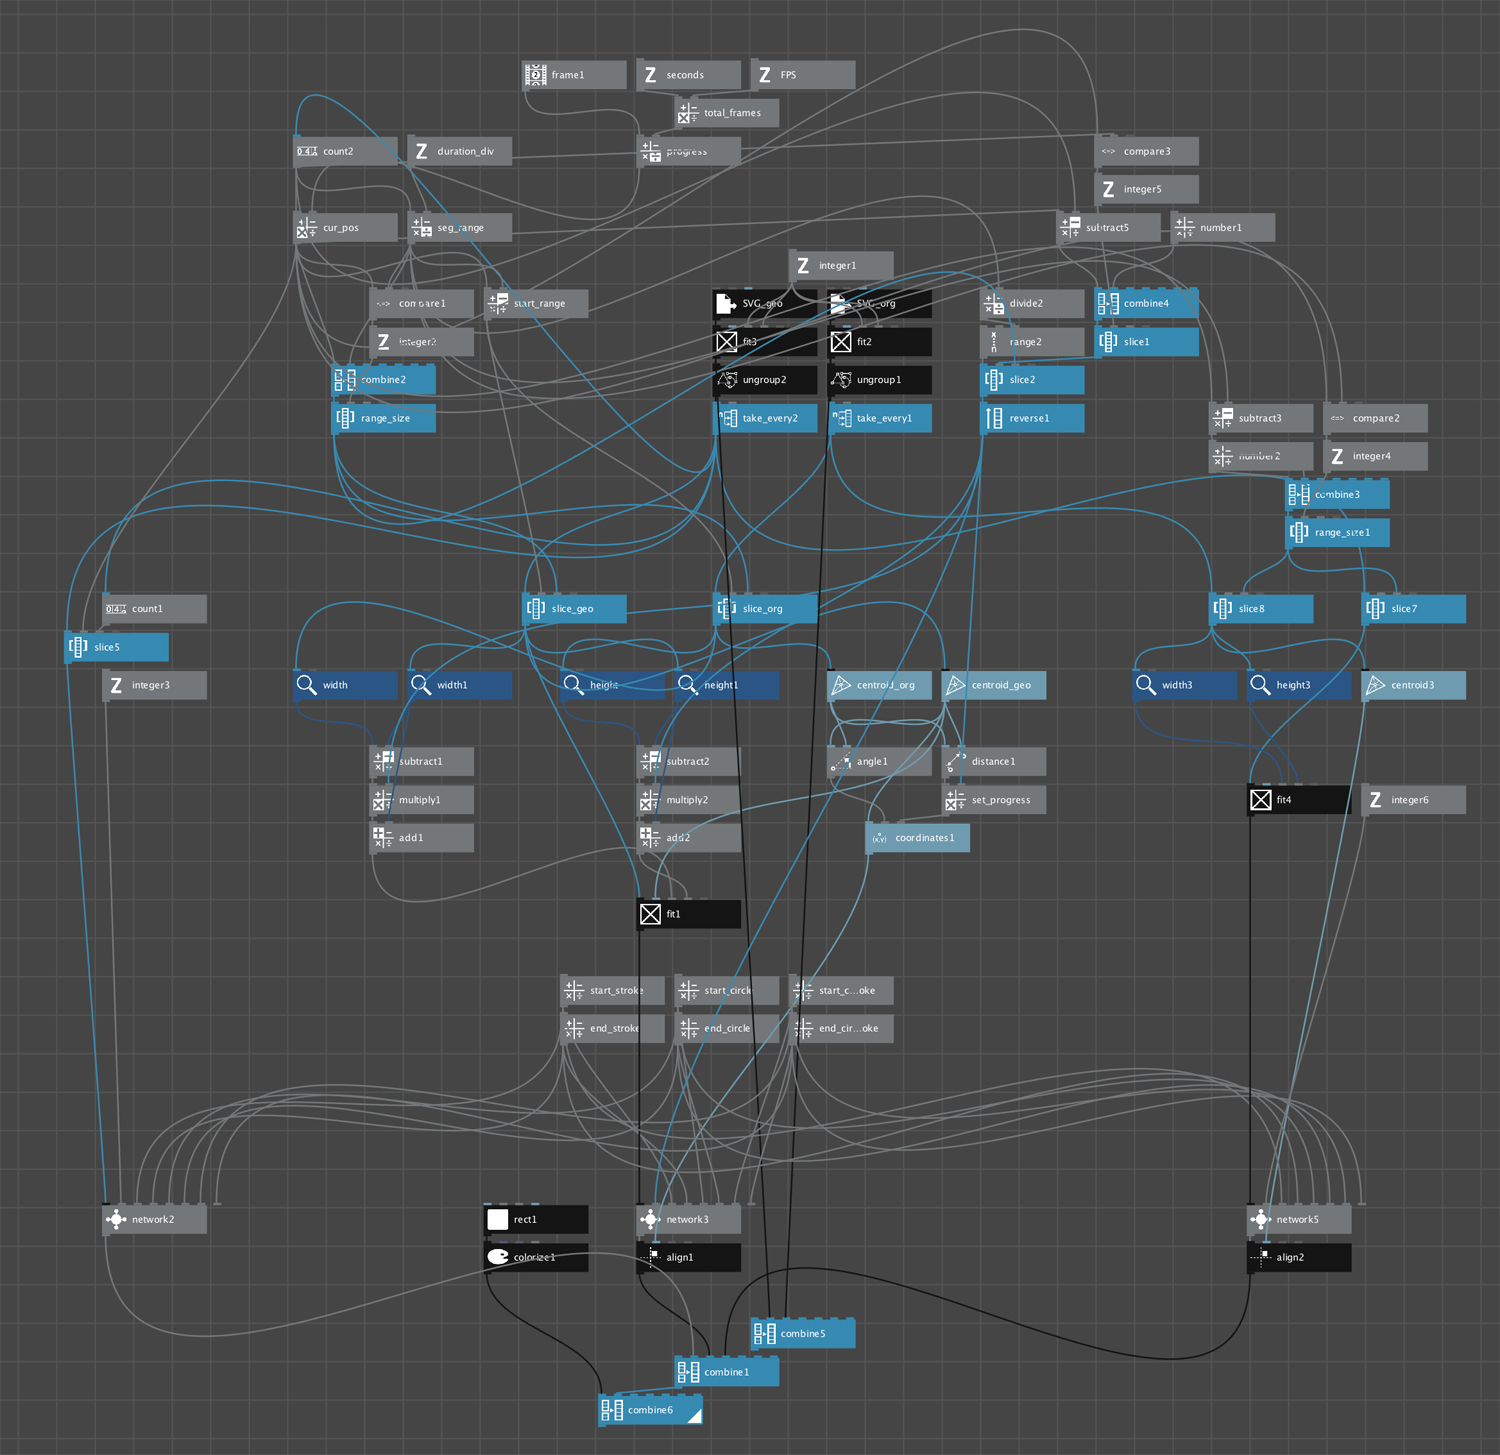
Nodebox settings to animate segments from map to diagram.
This was very much a labor of love. The cleanup process proved to be much more time-consuming than I expected but I'm pleased with the results. I hope others enjoy them.