Explanation
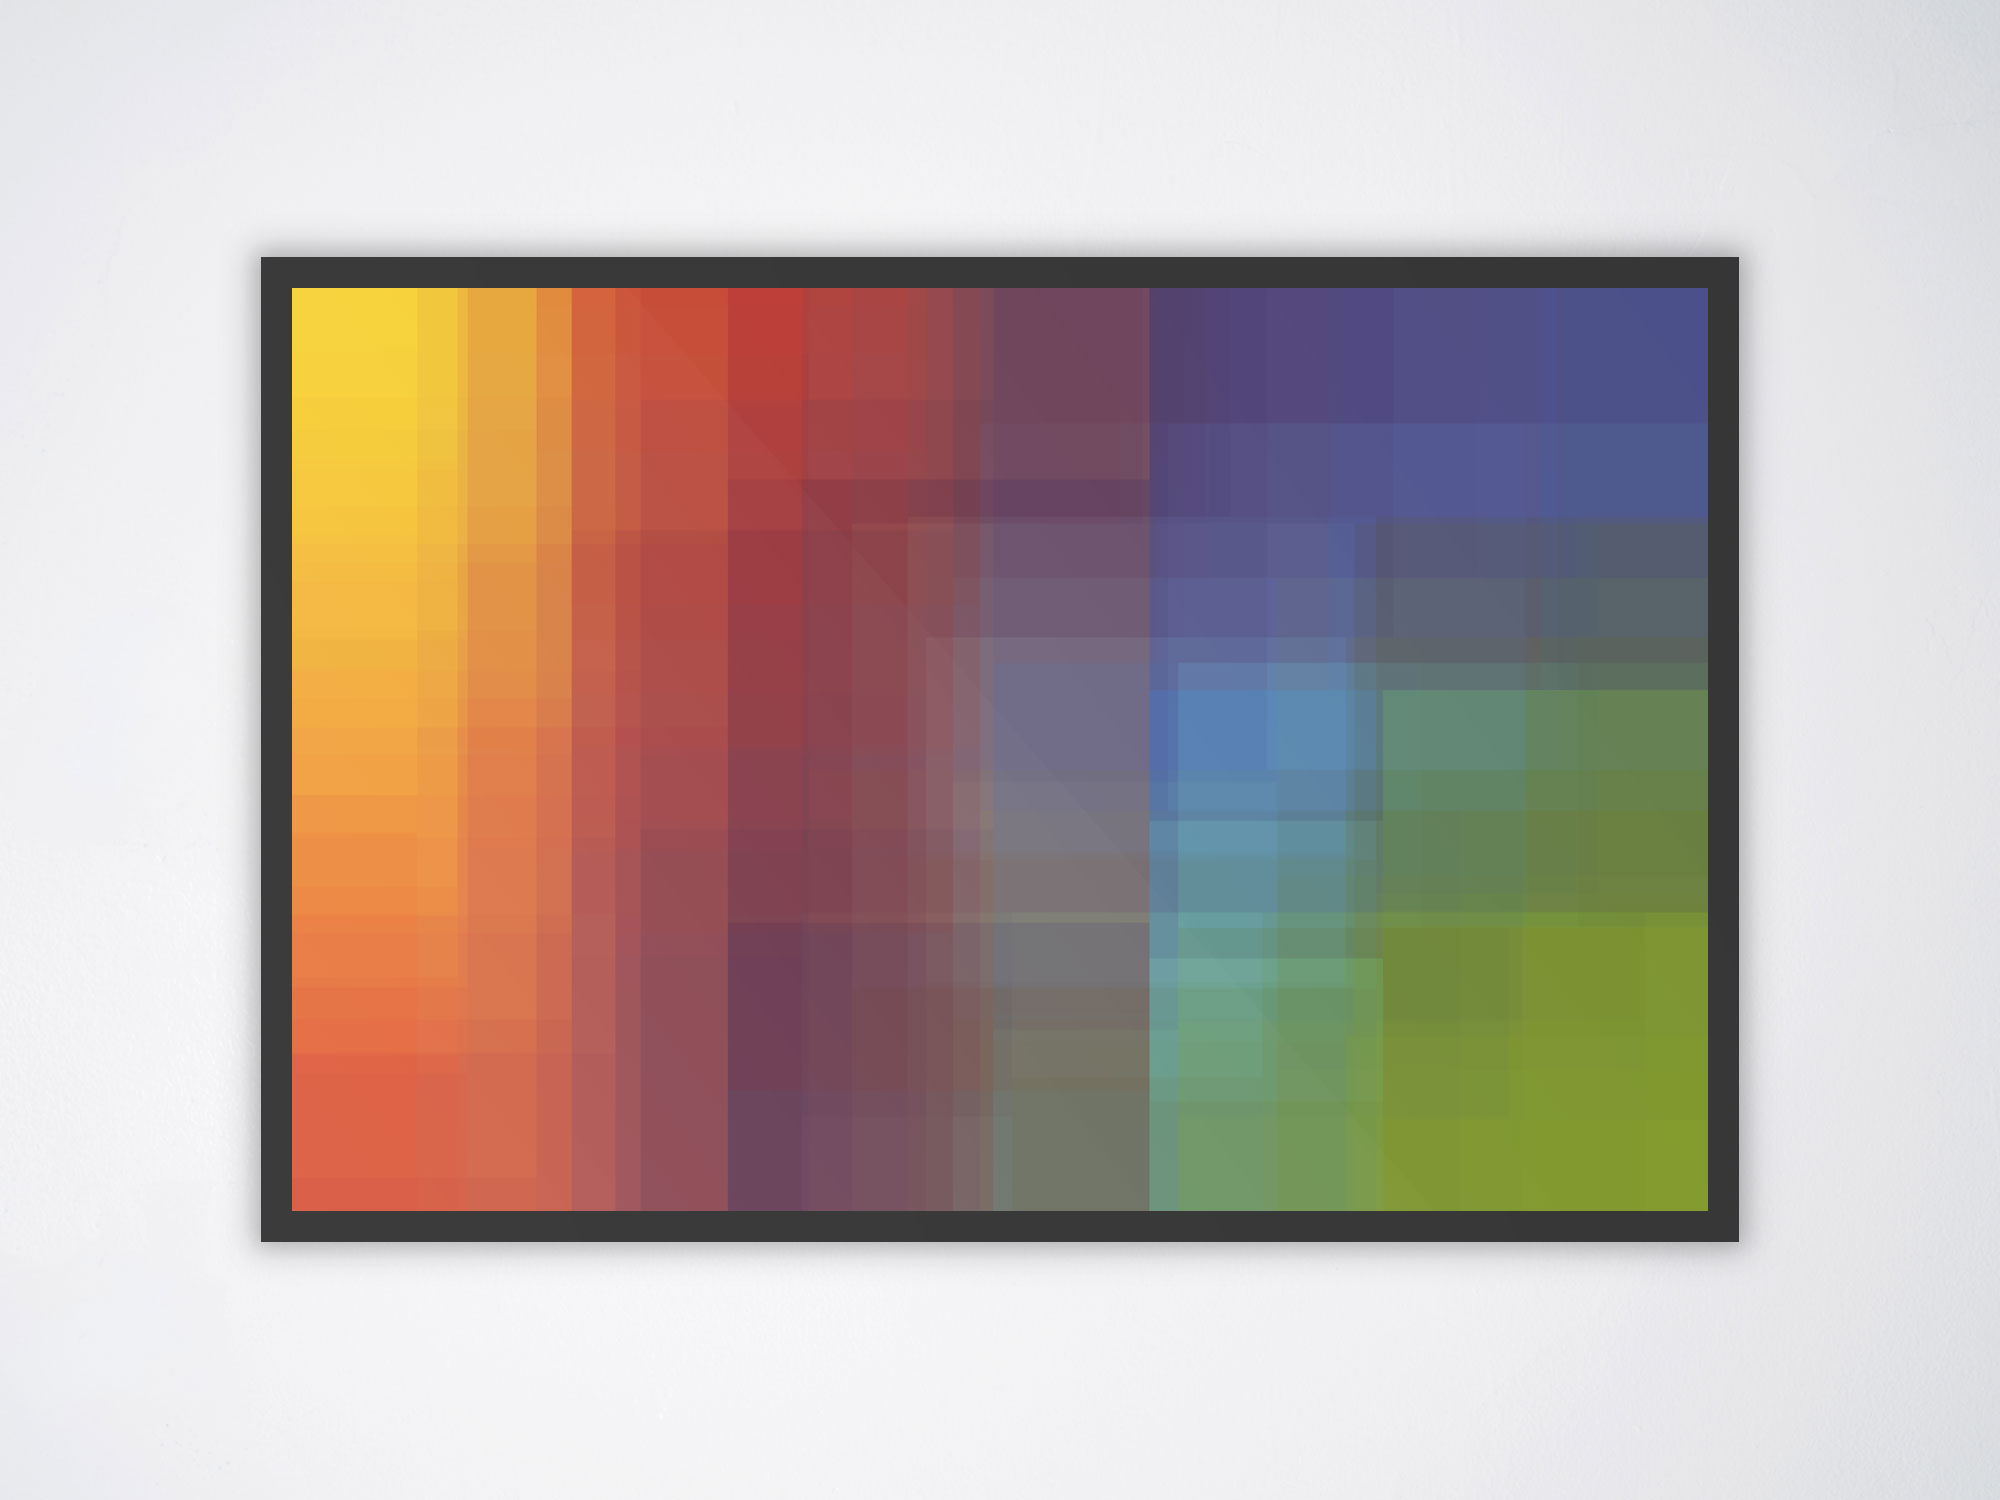
Each subject in Iconographic Encylopædia was analyzed using ten metrics. Charting those metrics as treemaps and then layering them on top of each other and blending the transparency results in the textured image above. The subjects for each metric were arranged in the order they appear in the original text with the first typically appearing near the top left and the last appearing around the bottom right. Subjects are also color coded
-
Total figures
-
Total plates
-
Total words
-
Total characters
-
Total figure references
-
Average figures on a plate
-
Average figure references per word
-
Average references per figure
-
Average words per figure reference
-
Average words per plate