Explanation
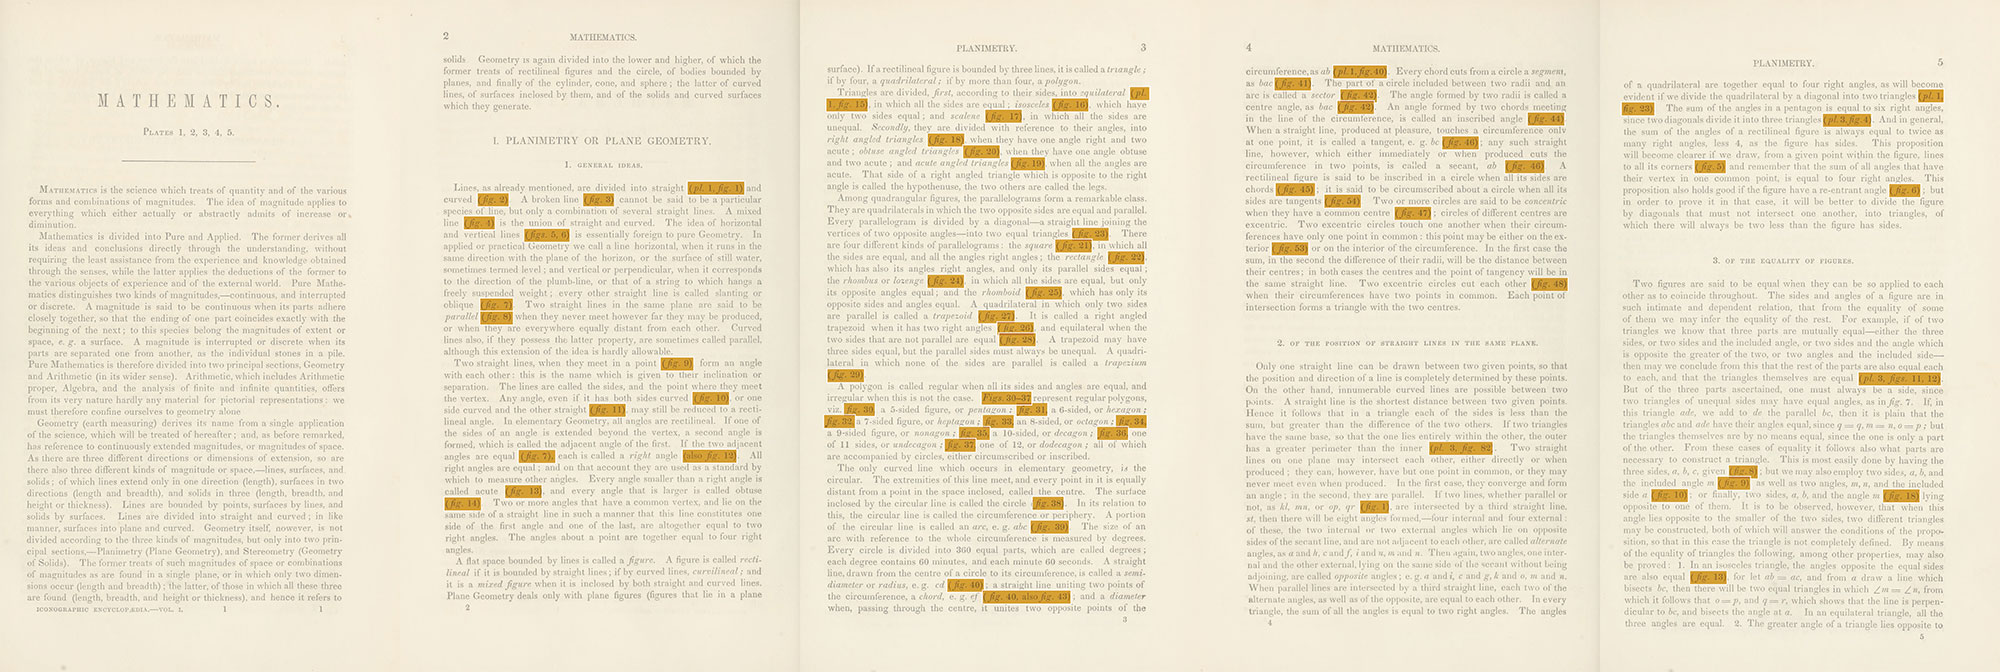
Scattered throughout the description of each subject in Iconographic Encyclopædia are 80–2,500 references to figures illustrated on 500 plates that accompany the text. These appear as “fig. 5“ or “pl. 3, fig. 45–47.”

The position of where each appears in the text was tracked and aggregated into groups, which were then plotted in order as a histogram that shows how many references to figures appear in each group of 3,000 characters from the HTML that structures them (larger circles and higher peaks = more references).

This technique was applied to all references throughout the text for every subject and strung together into one continuous line. That line was then split into 50 equal parts and stacked vertically and stretched horizontally, resulting in the image above.
